
贡献图表
贡献图表
目录
[toc]
简介
来给自己的Teek博客增加一个
贡献图标功能。😊
贡献图表:
- 数据可视化:通过日历热力图形式(类似 GitHub 贡献图)展示近 365 天文章发布频率,颜色深浅反映创作密度
- 创作激励:直观呈现内容更新趋势,帮助作者回顾创作周期,激励持续输出
- 访客感知:向访问者展示网站内容更新频率,增强内容可信度与专业形象
- 技术集成:基于 ECharts实现交互式图表,支持暗黑/亮色主题自动适配,响应式布局适配不同设备
版权
警告
本着开源共享、共同学习的精神:
本文是在 《天客 - Teeker》博主的源码 基础上增加了一些自己的实际操作记录和修改,内容依旧属于原作者所有。转载无需和我联系,但请注明文章来源。如果侵权之处,请联系博主进行删除,谢谢。
环境
2025.5.9(已解决)
警告
次配置适用于Teek@1.1.4-2025.5.8版本(其它版本可自行测试)。
提示
自己开源的 《vitepress-theme-teek-one-public》网站模板。
此模板是在《Young Kbt blog》大佬开源项目《vitepress-theme-teek 》基础上修改为自己的风格而成,感谢大佬开发得主题,大佬威武。❤️❤️
安装
(1)安装依赖
bash
pnpmadd-Decharts(2)新建组件
创建docs\.vitepress\theme\components\ContributeChart.vue文件,添加如下代码:
vue
<scriptsetuplang="ts"name="ContributeChart">import*asecharts from"echarts";import{ref,watch,nextTick,computed,useTemplateRef } from"vue";import{useData } from"vitepress";import{formatDate,usePosts } from"vitepress-theme-teek";const{isDark} =useData();constposts=usePosts();consttoday=formatDate(newDate(),"yyyy-MM-dd");constbeforeOnYear=formatDate(newDate(newDate().getTime() -365*24*60*60*1000),"yyyy-MM-dd");constcontributeList=computed(() =>{constcontributeObject=ref({});posts.value.sortPostsByDate.forEach(item=>{constdate=item.date.substring(0,10);if(contributeObject.value[date]) contributeObject.value[date]++;elsecontributeObject.value[date] =1;});constcontributeDays=Object.keys(contributeObject.value);returncontributeDays.map((item:string) =>[item,contributeObject.value[item]]).reverse();});constchartRef=useTemplateRef("chartRef");constcontributeChart=ref();constoption={tooltip:{formatter:function(params) {return`${params.value[0]} <br/> ${params.value[1]} 篇文章`;},},visualMap:{show:false,min:0,max:5,inRange:{color:["#ebedf0","#c6e48b","#7bc96f","#239a3b","#196127","#196127"],},},calendar:{left:"center",itemStyle:{color:"#ebedf0",borderWidth:5,borderColor:"#fff",shadowBlur:0,},cellSize:[20,20],range:[beforeOnYear,today],splitLine:true,dayLabel:{firstDay:7,nameMap:"ZH",color:"#3c3c43",},monthLabel:{color:"#3c3c43",},yearLabel:{show:true,position:"right",},silent:{show:false,},},series:{type:"heatmap",coordinateSystem:"calendar",data:[],},};constrenderChart=(data:any) =>{option.calendar.itemStyle.borderColor =isDark.value ?"#1b1b1f":"#fff";option.calendar.itemStyle.color =isDark.value ?"#787878":"#ebedf0";if(contributeChart.value) echarts.dispose(contributeChart.value);if(chartRef.value) contributeChart.value =echarts.init(chartRef.value);option.series.data =data;contributeChart.value.setOption(option);};watch(contributeList,asyncnewValue=>{awaitnextTick();renderChart(newValue);},{immediate:true});watch(isDark,() =>{renderChart(contributeList.value);});</script><template><divclass="contribute__chart"><divclass="chart__box"ref="chartRef"></div></div></template><style>.tk-page.tk-archives{max-width:1220px;}.tk-archives.contribute__chart{width:100%;height:260px;}.tk-archives.contribute__chart.chart__box{margin:auto;width:100%;height:100%;}</style>(3)注册组件
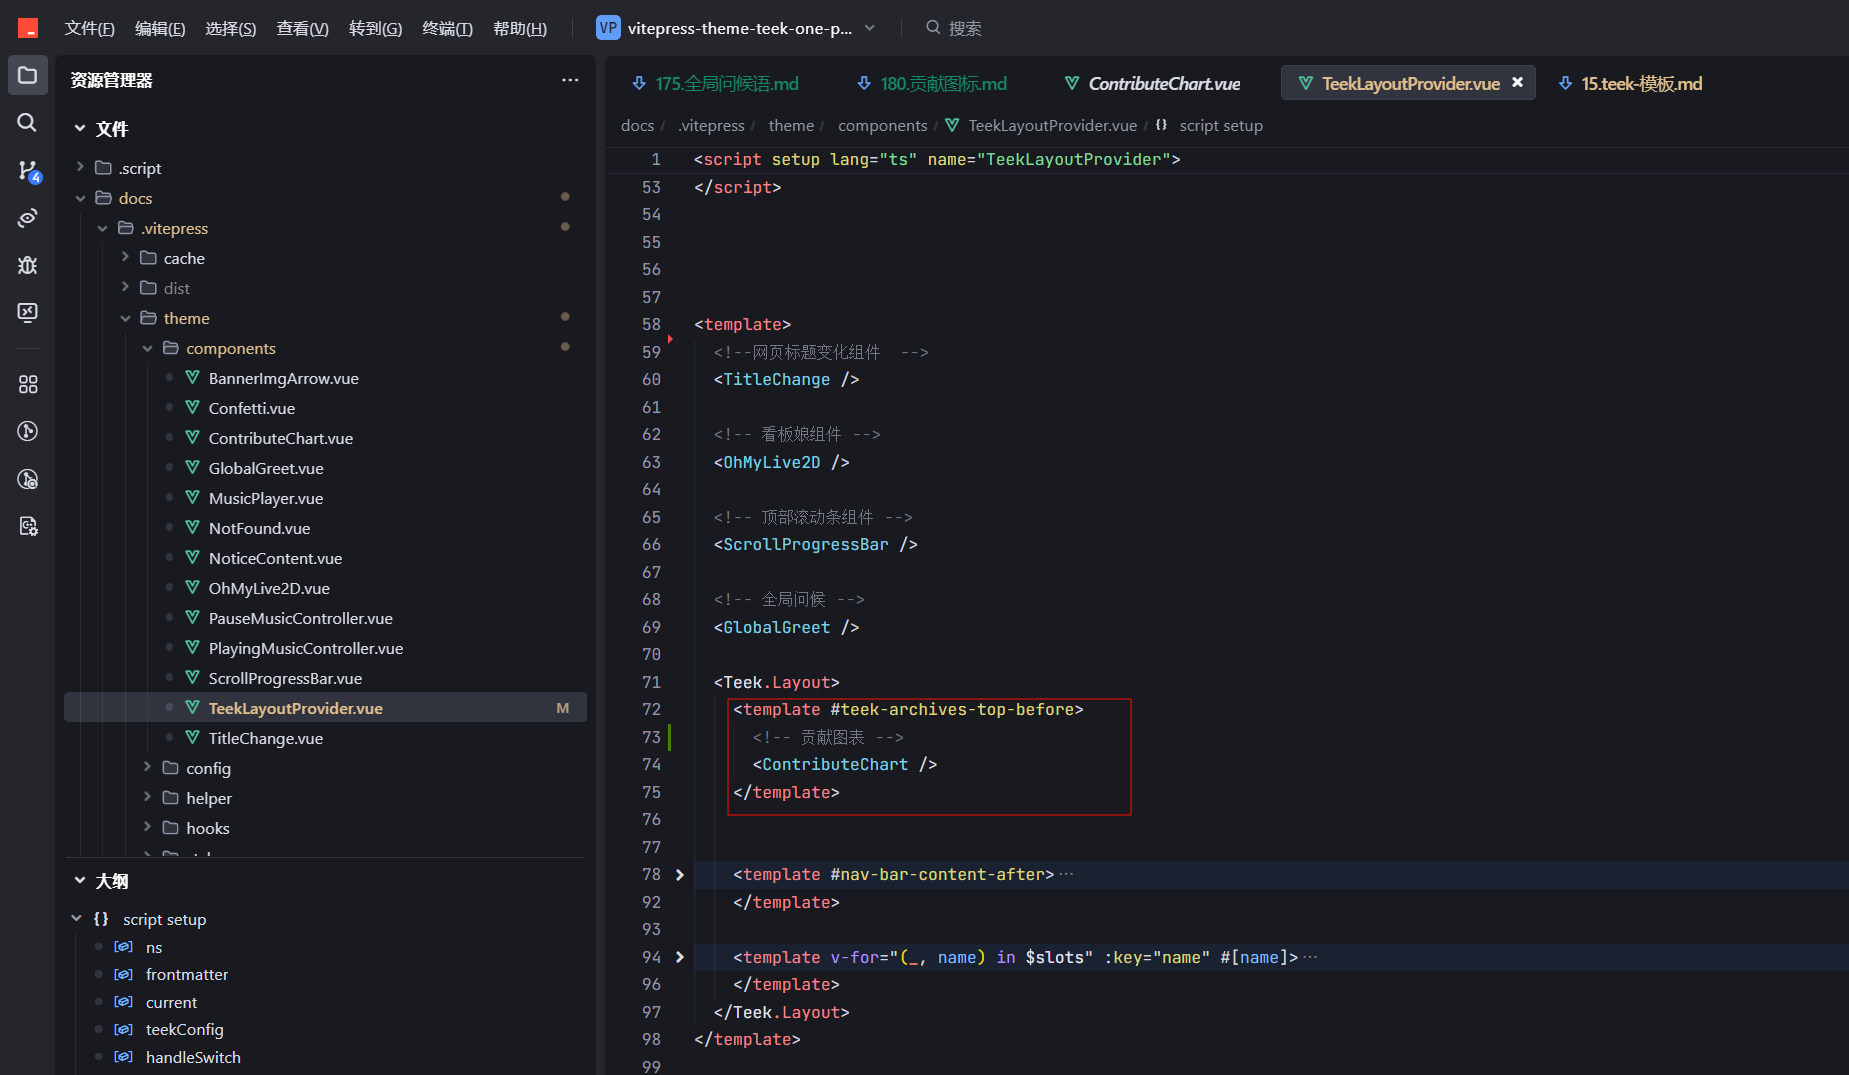
编辑docs\.vitepress\theme\components\TeekLayoutProvider.vue文件,添加如下代码:(具体代码可从我开源库Teek-one里获取)
ts
importContributeChart from"./ContributeChart.vue";<template #teek-archives-top-before><!--贡献图表 --><ContributeChart /></template>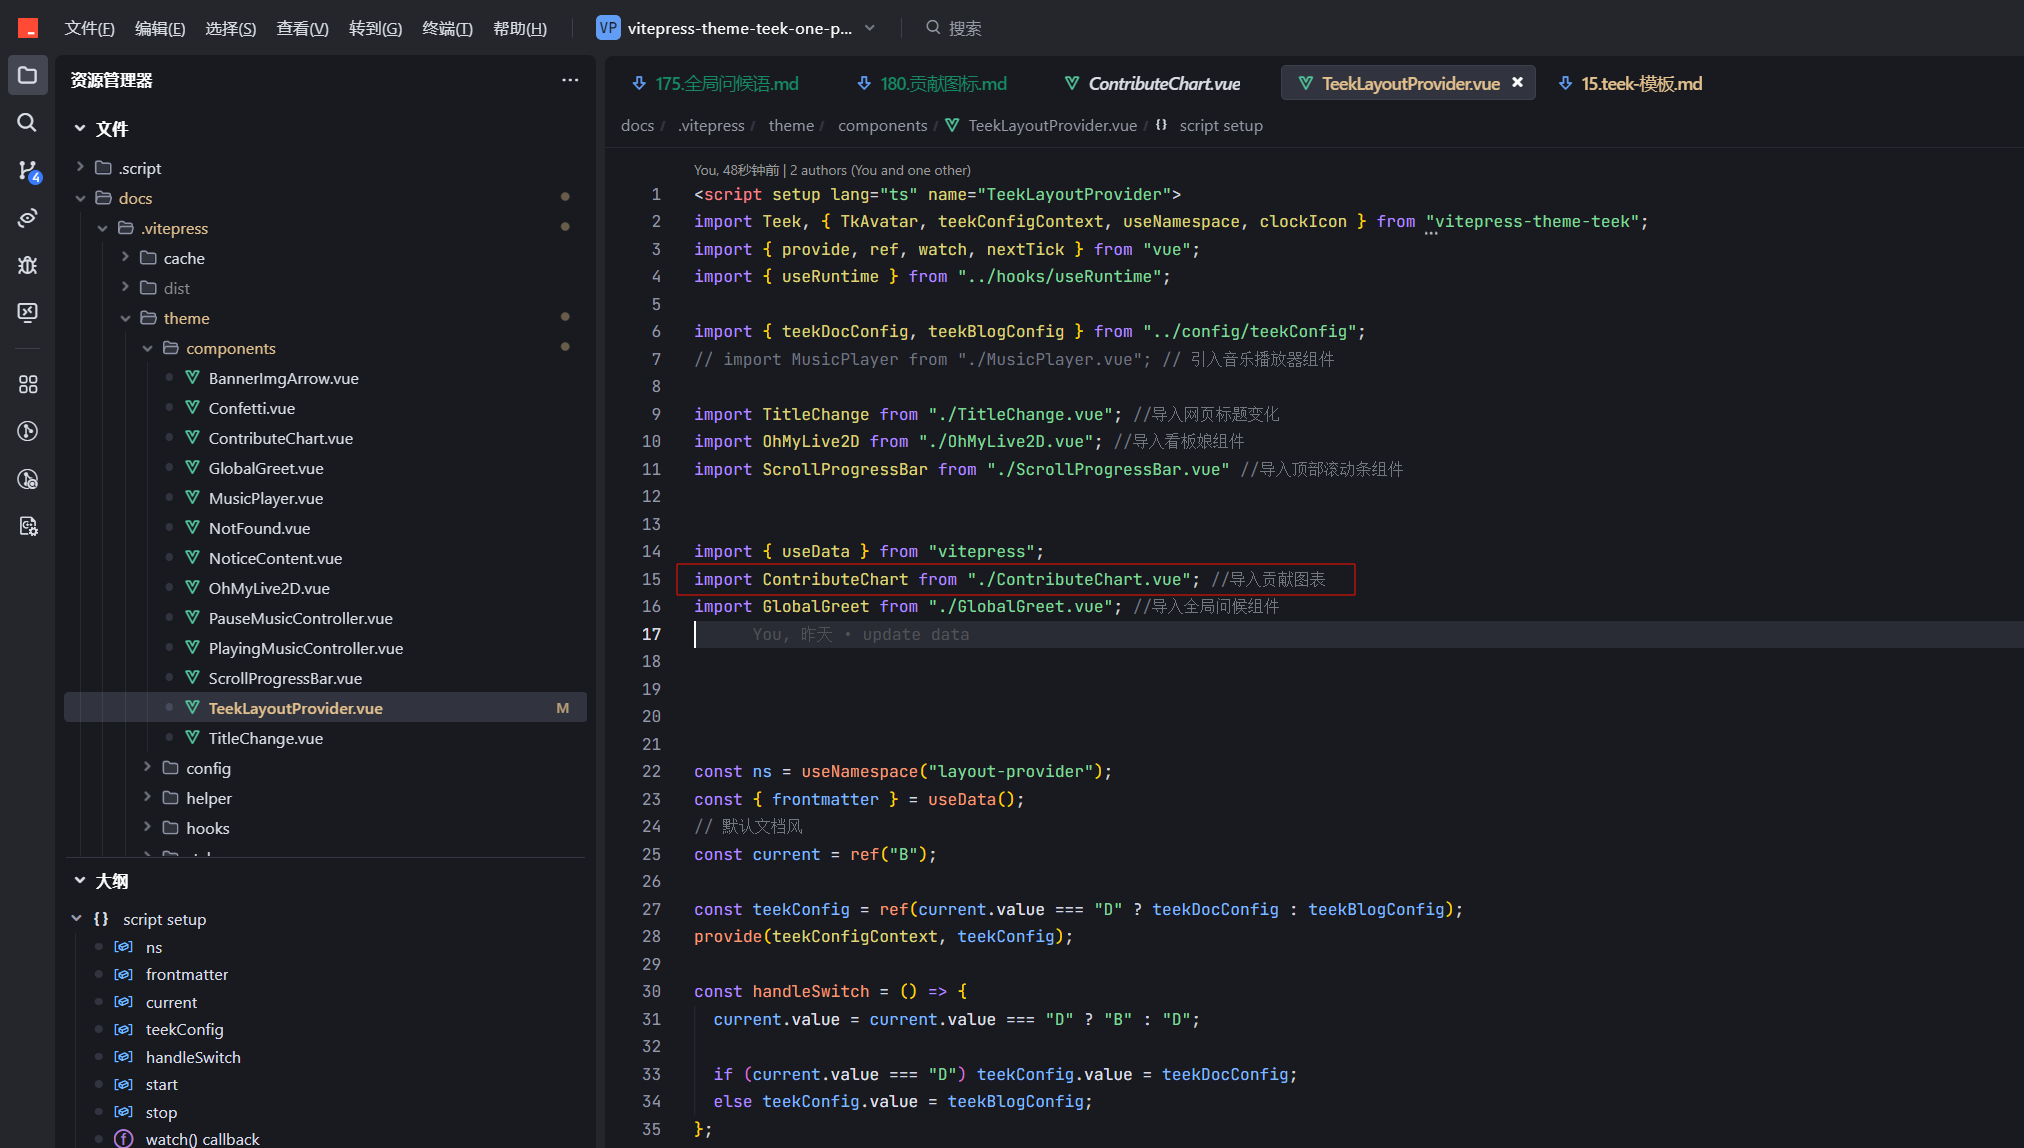
(4)运行测试
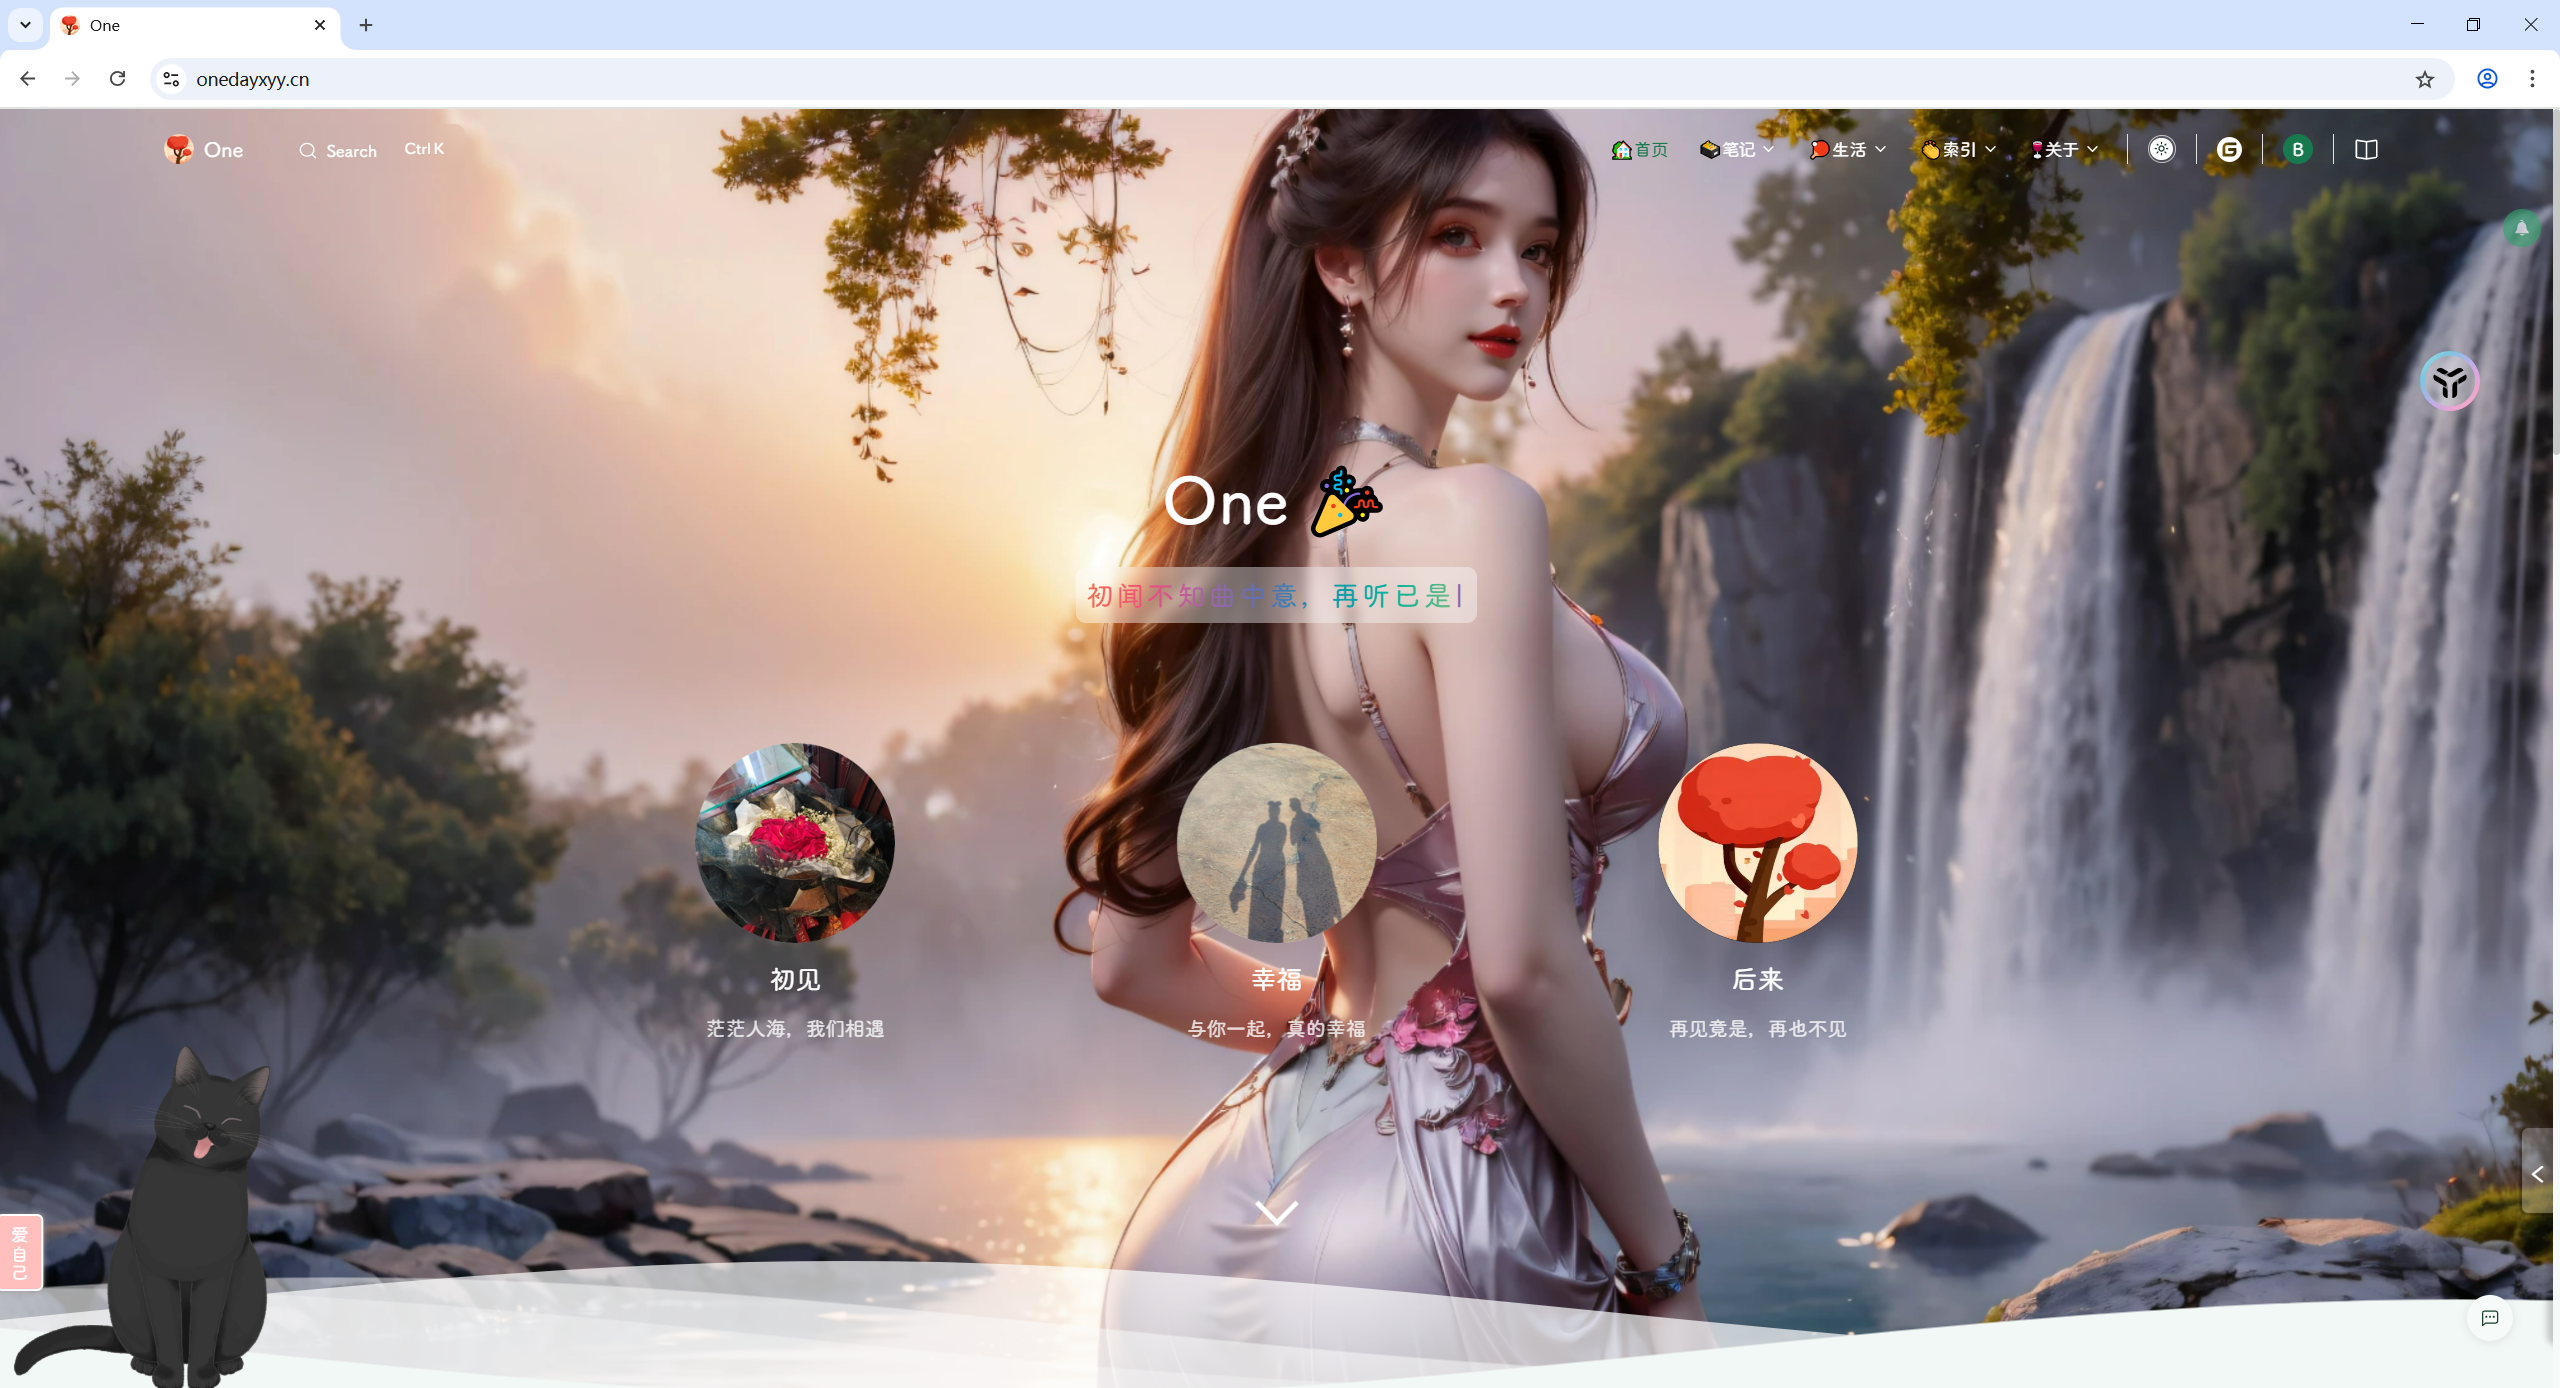
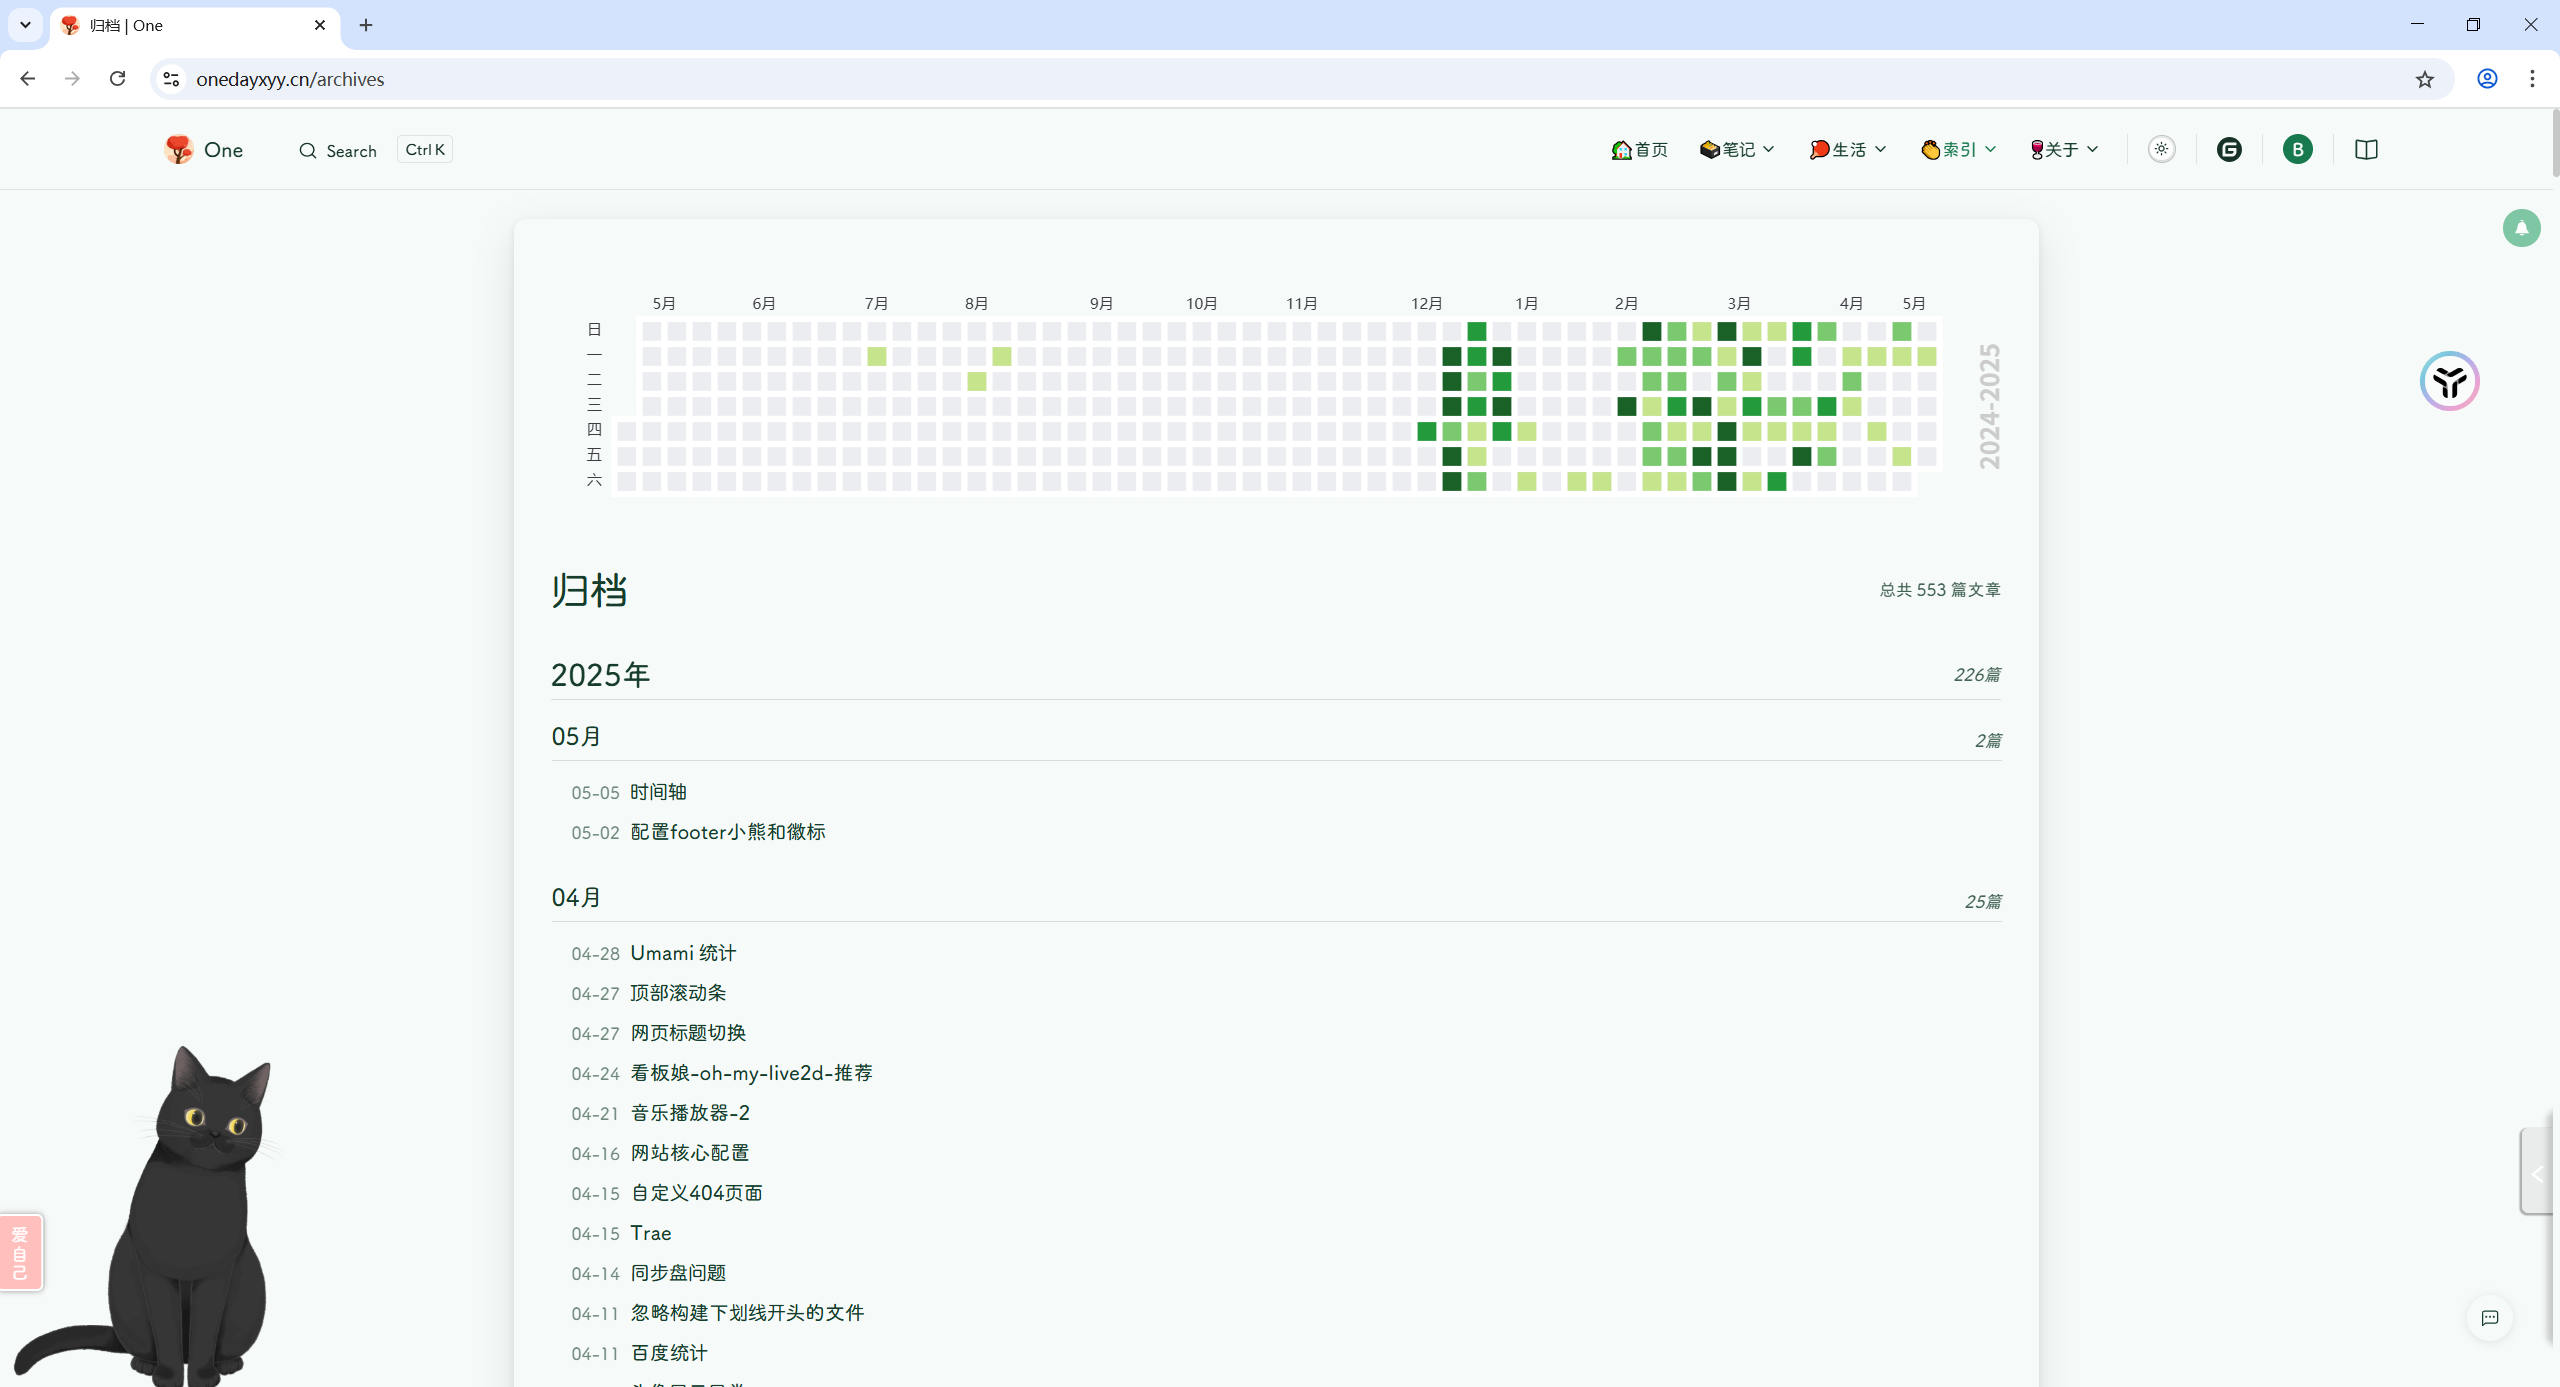
效果
来到归档页观察:
关于我
我的博客主旨:
- 排版美观,语言精炼;
- 文档即手册,步骤明细,拒绝埋坑,提供源码;
- 本人实战文档都是亲测成功的,各位小伙伴在实际操作过程中如有什么疑问,可随时联系本人帮您解决问题,让我们一起进步!
🍀 个人网站

🍀 微信二维码
x2675263825 (舍得), qq:2675263825。

🍀 微信公众号
《云原生架构师实战》

🍀 csdn
上次更新时间: