7、Istio可观测性
更新于:2023年12月7日08:
Istio可观测性
前言
Istio 为网格内所有的服务通信生成详细的遥测数据。这种遥测技术提供了服务行为的可观测性,使运维人员能够排查故障、维护和优化应用程序,而不会给开发人员带来其他额外的负担。通过 Istio,运维人员可以全面了解到受监控的服务如何与其他服务以及 Istio 组件进行交互。
Istio 生成以下类型的遥测数据,以提供对整个服务网格的可观测性:
- Metrics(指标):Istio 基于 4 个监控的黄金标识(延迟、流量、错误、饱和)生成了一系列服务指标,Istio 还为网格控制平面提供了更详细的指标。除此以外还提供了一组默认的基于这些指标的网格监控仪表板。
- Tracing(分布式追踪):Istio 为每个服务生成分布式追踪 span,运维人员可以理解网格内服务的依赖和调用流程。
- Log(访问日志):当流量流入网格中的服务时,Istio 可以生成每个请求的完整记录,包括源和目标的元数据,该信息使运维人员能够将服务行为的审查控制到单个工作负载实例的级别。
接下来我们将分别来学习 Istio 的指标、分布式追踪和访问日志是如何工作的。
1、指标
指标提供了一种以聚合的方式监控和理解行为的方法。为了监控服务行为,Istio 为服务网格中所有出入网格,以及网格内部的服务流量都生成了指标,这些指标提供了关于行为的信息,例如总流量、错误率和请求响应时间。除了监控网格中服务的行为外,监控网格本身的行为也很重要。Istio 组件还可以导出自身内部行为的指标,以提供对网格控制平面的功能和健康情况的洞察能力。
指标类别
整体上 Istio 的指标可以分成 3 个级别:代理级别、服务级别、控制平面级别。
1、代理级别指标
Istio 指标收集从 Envoy Sidecar 代理开始,每个代理为通过它的所有流量(入站和出站)生成一组丰富的指标。代理还提供关于它本身管理功能的详细统计信息,包括配置信息和健康信息。
Envoy 生成的指标提供了资源(例如监听器和集群)粒度上的网格监控。因此,为了监控 Envoy 指标,需要了解网格服务和 Envoy 资源之间的连接。
Istio 允许运维人员在每个工作负载实例上选择生成和收集哪些 Envoy 指标。默认情况下,Istio 只支持 Envoy 生成的统计数据的一小部分,以避免依赖过多的后端服务,还可以减少与指标收集相关的 CPU 开销。但是运维人员可以在需要时轻松地扩展收集到的代理指标数据。这样我们可以有针对性地调试网络行为,同时降低了跨网格监控的总体成本。
2、服务级别指标
除了代理级别指标之外,Istio 还提供了一组用于监控服务通信的面向服务的指标。这些指标涵盖了四个基本的服务监控需求:延迟、流量、错误和饱和情况。而且 Istio 还自带了一组默认的仪表板,用于监控基于这些指标的服务行为。默认情况下,标准 Istio 指标会导出到 Prometheus。而且服务级别指标的使用完全是可选的,运维人员可以根据自身的需求来选择关闭指标的生成和收集。
3、控制平面指标
另外 Istio 控制平面还提供了一组自我监控指标。这些指标允许监控 Istio 自己的行为。
通过 Prometheus 查询指标
Istio 默认使用 Prometheus 来收集和存储指标。Prometheus 是一个开源的系统监控和警报工具包,它可以从多个源收集指标,并允许运维人员通过 PromQL 查询语言来查询收集到的指标。
- 首先要确保 Istio 的
prometheus组件已经启用,如果没有启用可以通过以下命令启用:
[root@master1 ~]#cd istio-1.19.3/
[root@master1 istio-1.19.3]#ls samples/addons/
extras  grafana.yaml  jaeger.yaml  kiali.yaml  loki.yaml  prometheus.yaml  README.md

#部署
kubectl apply -f samples/addons上面的命令会安装 Kiali,包括 Prometheus、Grafana 以及 jaeger。当然这仅仅只能用于测试环境,在生产环境可以单独安装 Prometheus 进行有针对性的配置优化。
- 安装后可以通过以下命令查看 Prometheus 服务状态:
$ kubectl get svc prometheus -n istio-system
NAME         TYPE        CLUSTER-IP       EXTERNAL-IP   PORT(S)    AGE
prometheus   ClusterIP   10.106.228.196   <none>        9090/TCP   25d
$ kubectl get pods -n istio-system -l app=prometheus
NAME                         READY   STATUS    RESTARTS       AGE
prometheus-5d5d6d6fc-2gtxm 2/2 Running 0 25d- 首先在浏览器中访问
http://$GATEWAY_URL/productpage应用,然后我们就可以打开 Prometheus UI 来查看指标了。在 Kubernetes 环境中,执行如下命令就可以打开 Prometheus UI:
istioctl dashboard prometheus
# 也可以创建 Ingress 或者 Gateway 来访问 Prometheus UI

[root@master1 istio-1.19.3]#istioctl dashboard prometheus
http://localhost:9090
Failed to open browser; open http://localhost:9090 in your browser.

C[root@master1 istio-1.19.3]#istioctl dashboard prometheus --address 0.0.0.0
http://0.0.0.0:9090
Failed to open browser; open http://0.0.0.0:9090 in your browser.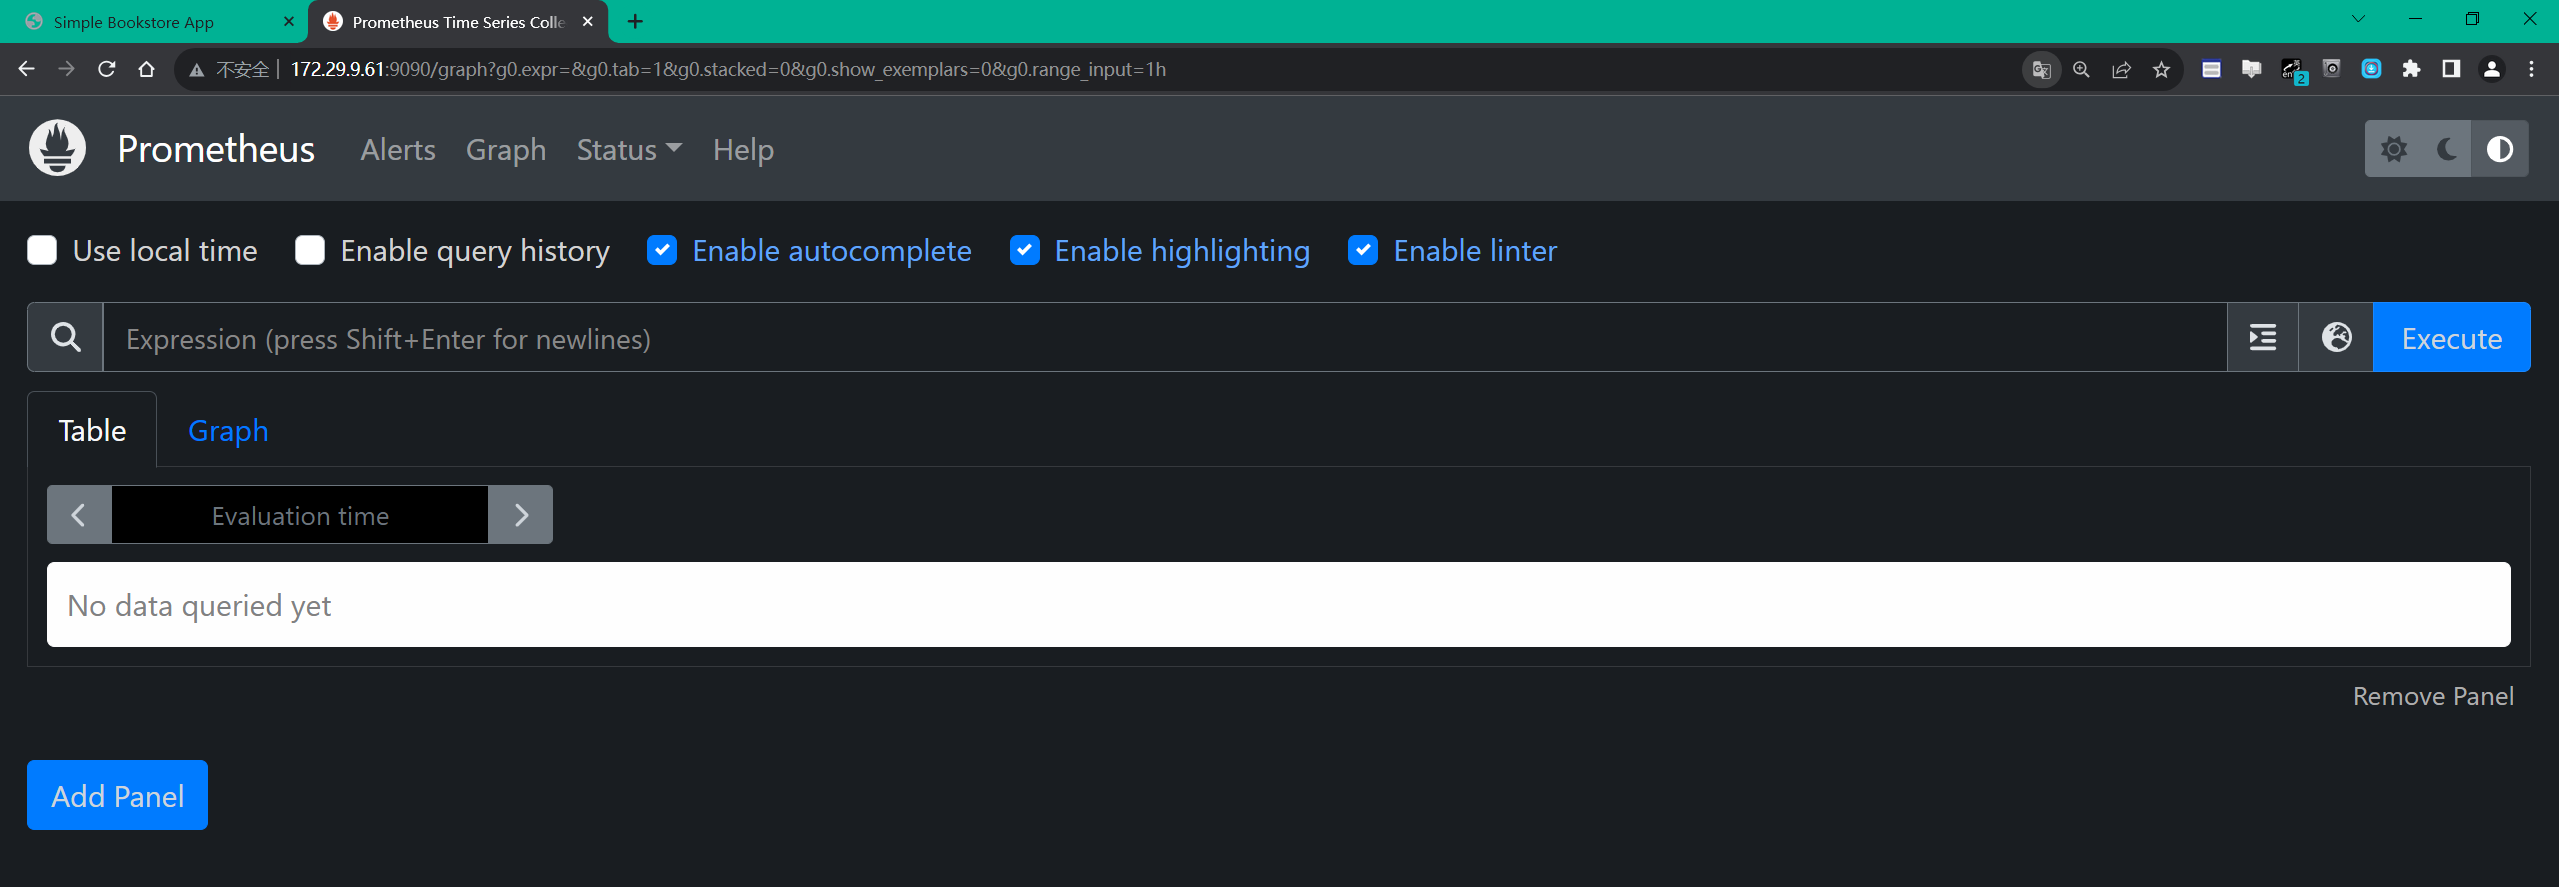
打开后我们可以在页面中随便查询一个指标,比如我们查询 istio_requests_total 指标,如下所示:
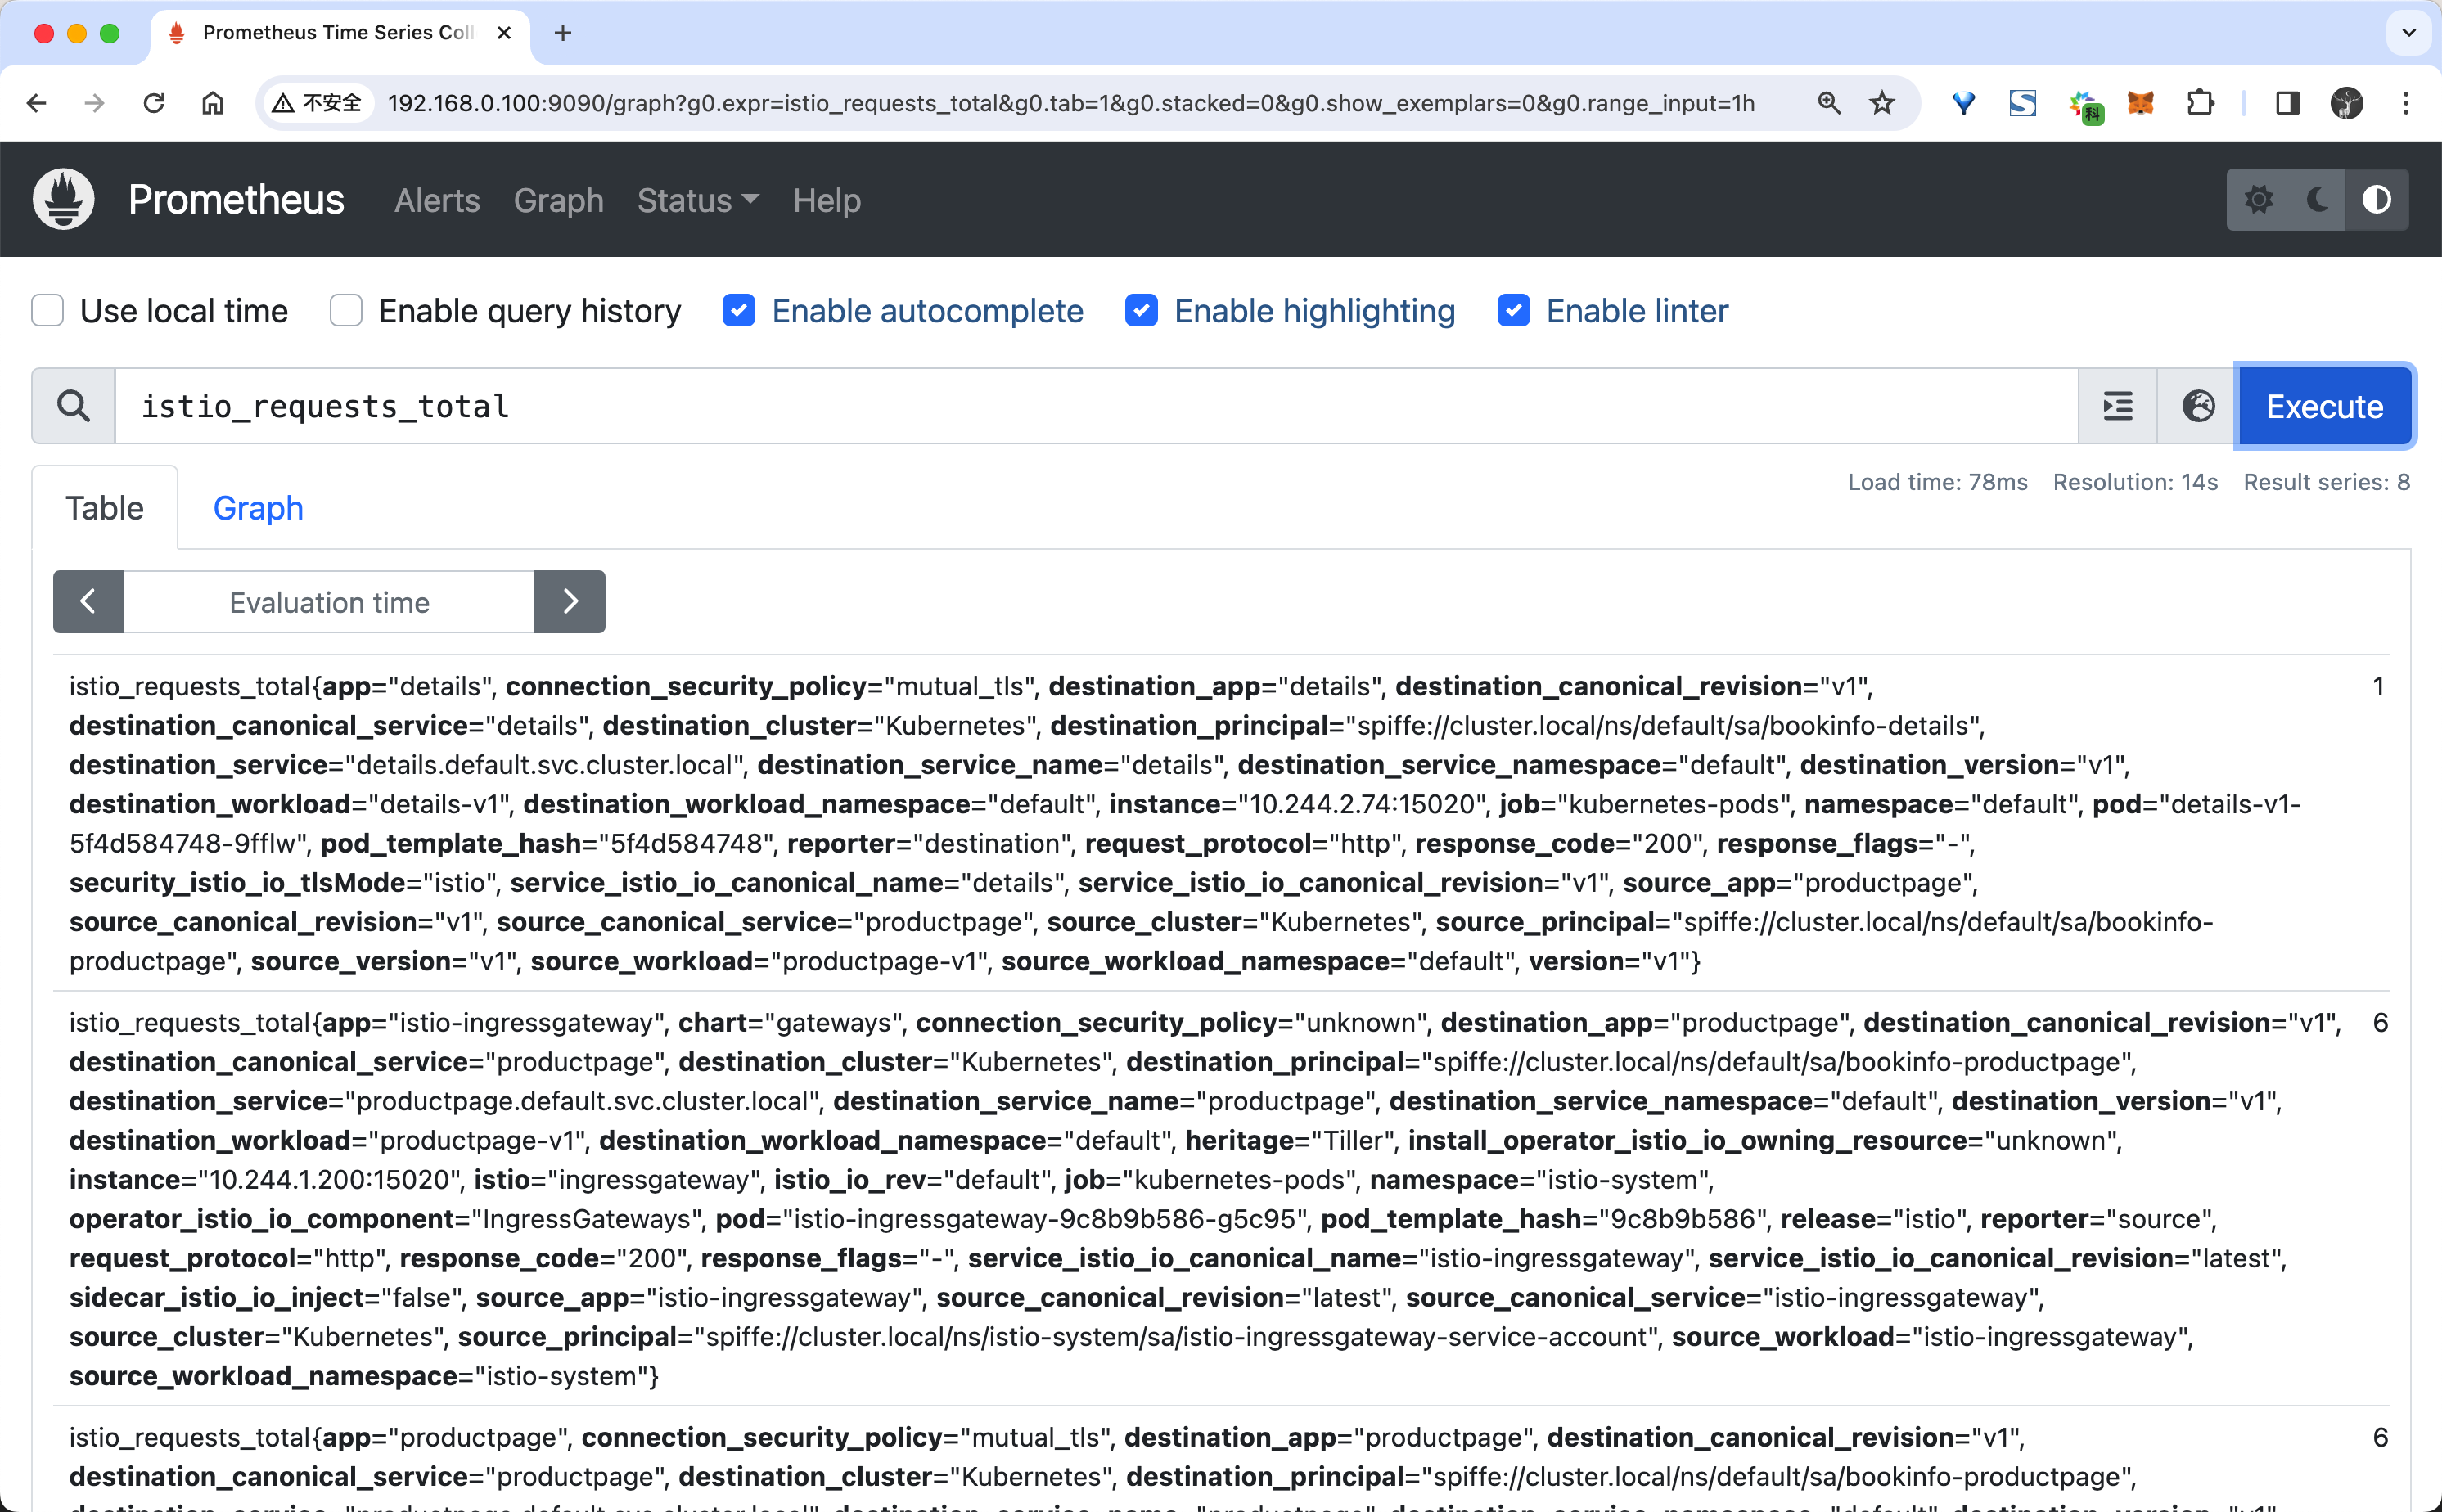
istio_requests_total 这是一个 COUNTER 类型的指标,用于记录 Istio 代理处理的总请求数。
- 当然然后可以根据自己需求来编写 promql 语句进行查询,比如查询 productpage 服务的总次数,可以用下面的语句:
istio_requests_total{destination_service="productpage.default.svc.cluster.local"}- 查询
reviews服务 v3 版本的总次数:
istio_requests_total{destination_service="reviews.default.svc.cluster.local", destination_version="v3"}该查询返回所有请求 reviews 服务 v3 版本的当前总次数。
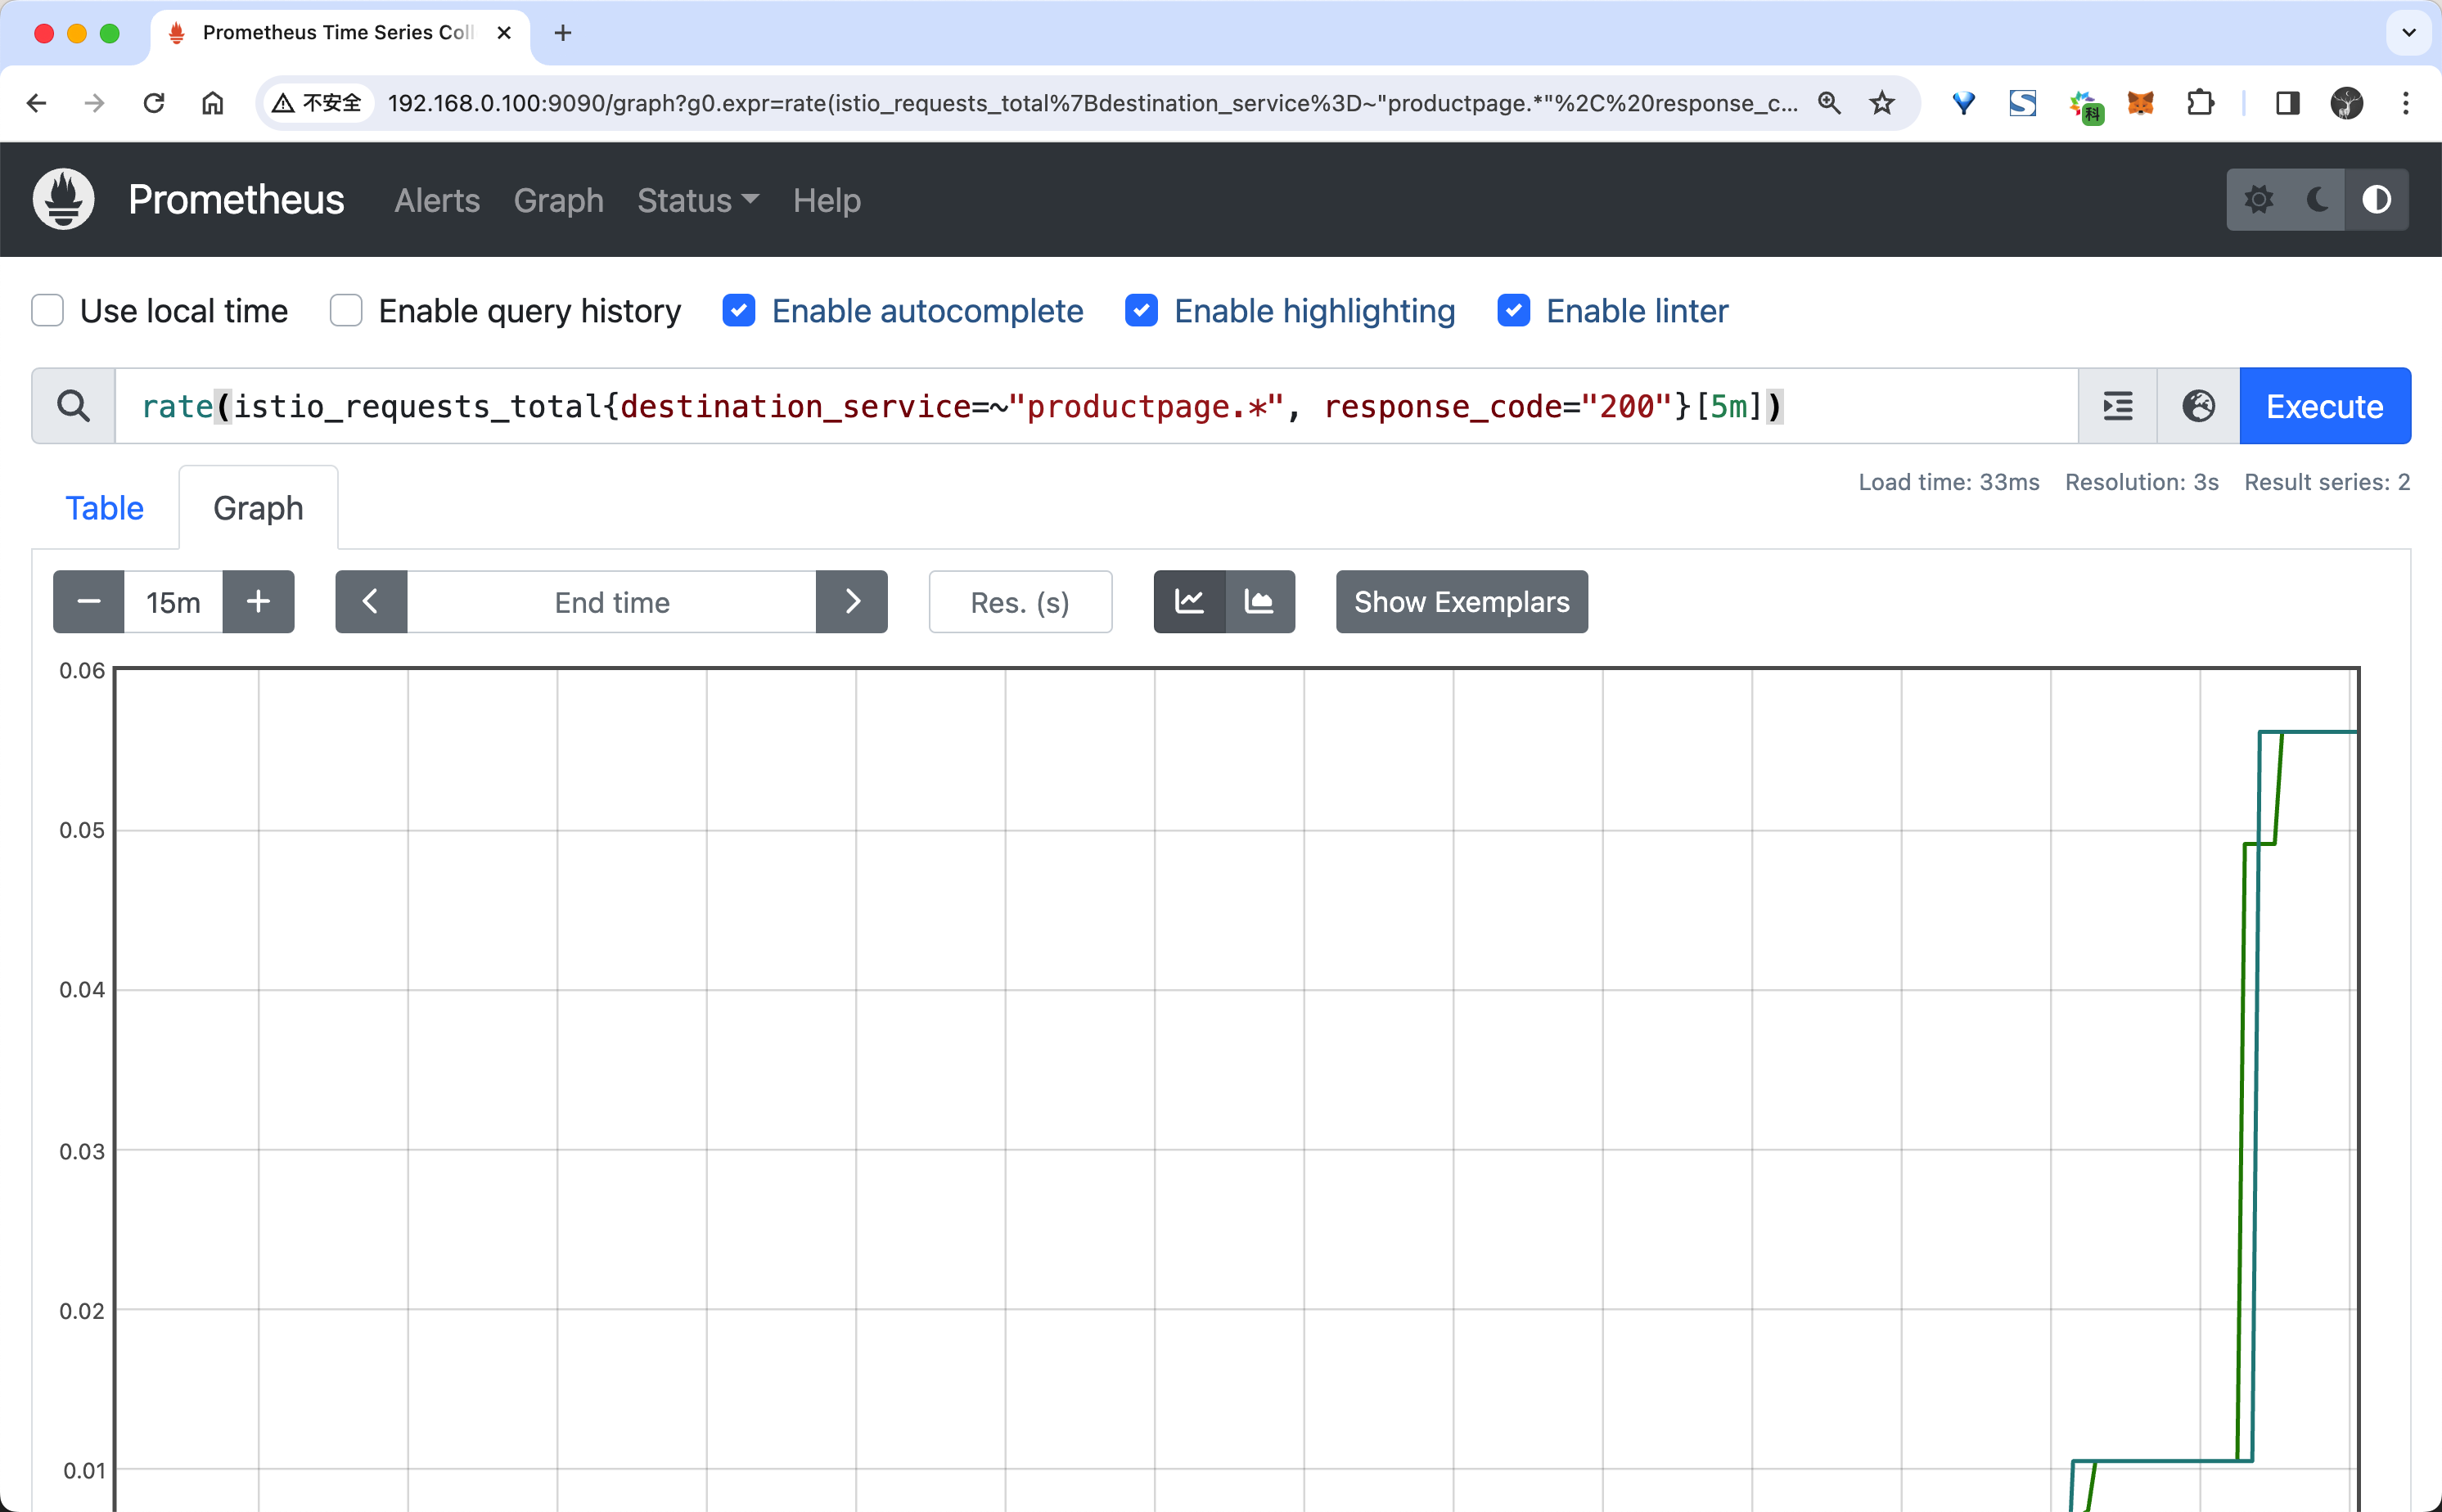
- 过去 5 分钟
productpage服务所有实例的请求频次:
rate(istio_requests_total{destination_service=~"productpage.*", response_code="200"}[5m])- 在
Graph选项卡中,可以看到查询结果的图形化表示。
对于 PromQL 语句的使用可以参考官方文档 Prometheus Querying Basics,或者我们的 《Prometheus 入门到实战》课程,这并不是我们这里的重点,所以就不再详细介绍了。
虽然我们这里并没有做任何的配置,但是 Istio 默认已经为我们收集了一些指标,所以我们可以直接查询到这些指标了。
使用 Grafana 可视化指标
Prometheus 提供了一个基本的 UI 来查询指标,但是它并不是一个完整的监控系统,更多的时候我们可以使用 Grafana 来可视化指标。
- 首先同样要保证 Istio 的
grafana组件已经启用,如果没有启用可以通过以下命令启用:
kubectl apply -f samples/addons- 并且要保证 Prometheus 服务正在运行,服务安装后可以通过下面的命令来查看状态:
$ kubectl -n istio-system get svc grafana
NAME      TYPE        CLUSTER-IP     EXTERNAL-IP   PORT(S)    AGE
grafana   ClusterIP   10.96.197.74   <none>        3000/TCP   25d
$ kubectl -n istio-system get pods -l app=grafana
NAME                       READY   STATUS    RESTARTS       AGE
grafana-5f9b8c6c5d-jv65v 1/1 Running 0 25d- 然后我们可以通过以下命令来打开 Grafana UI:
istioctl dashboard grafana
# 也可以创建 Ingress 或者 Gateway 来访问 Grafana

istioctl dashboard grafana --address 0.0.0.0然后我们就可以在浏览器中打开 Grafana UI 了,默认情况下 Grafana 已经配置了 Prometheus 数据源,所以我们可以直接使用 Prometheus 数据源来查询指标。
- 此外 Grafana 也已经内置了 Istio 的一些仪表盘,我们可以直接使用这些仪表盘来查看指标,比如我们可以打开
Istio Mesh Dashboard仪表盘来查看网格的指标:
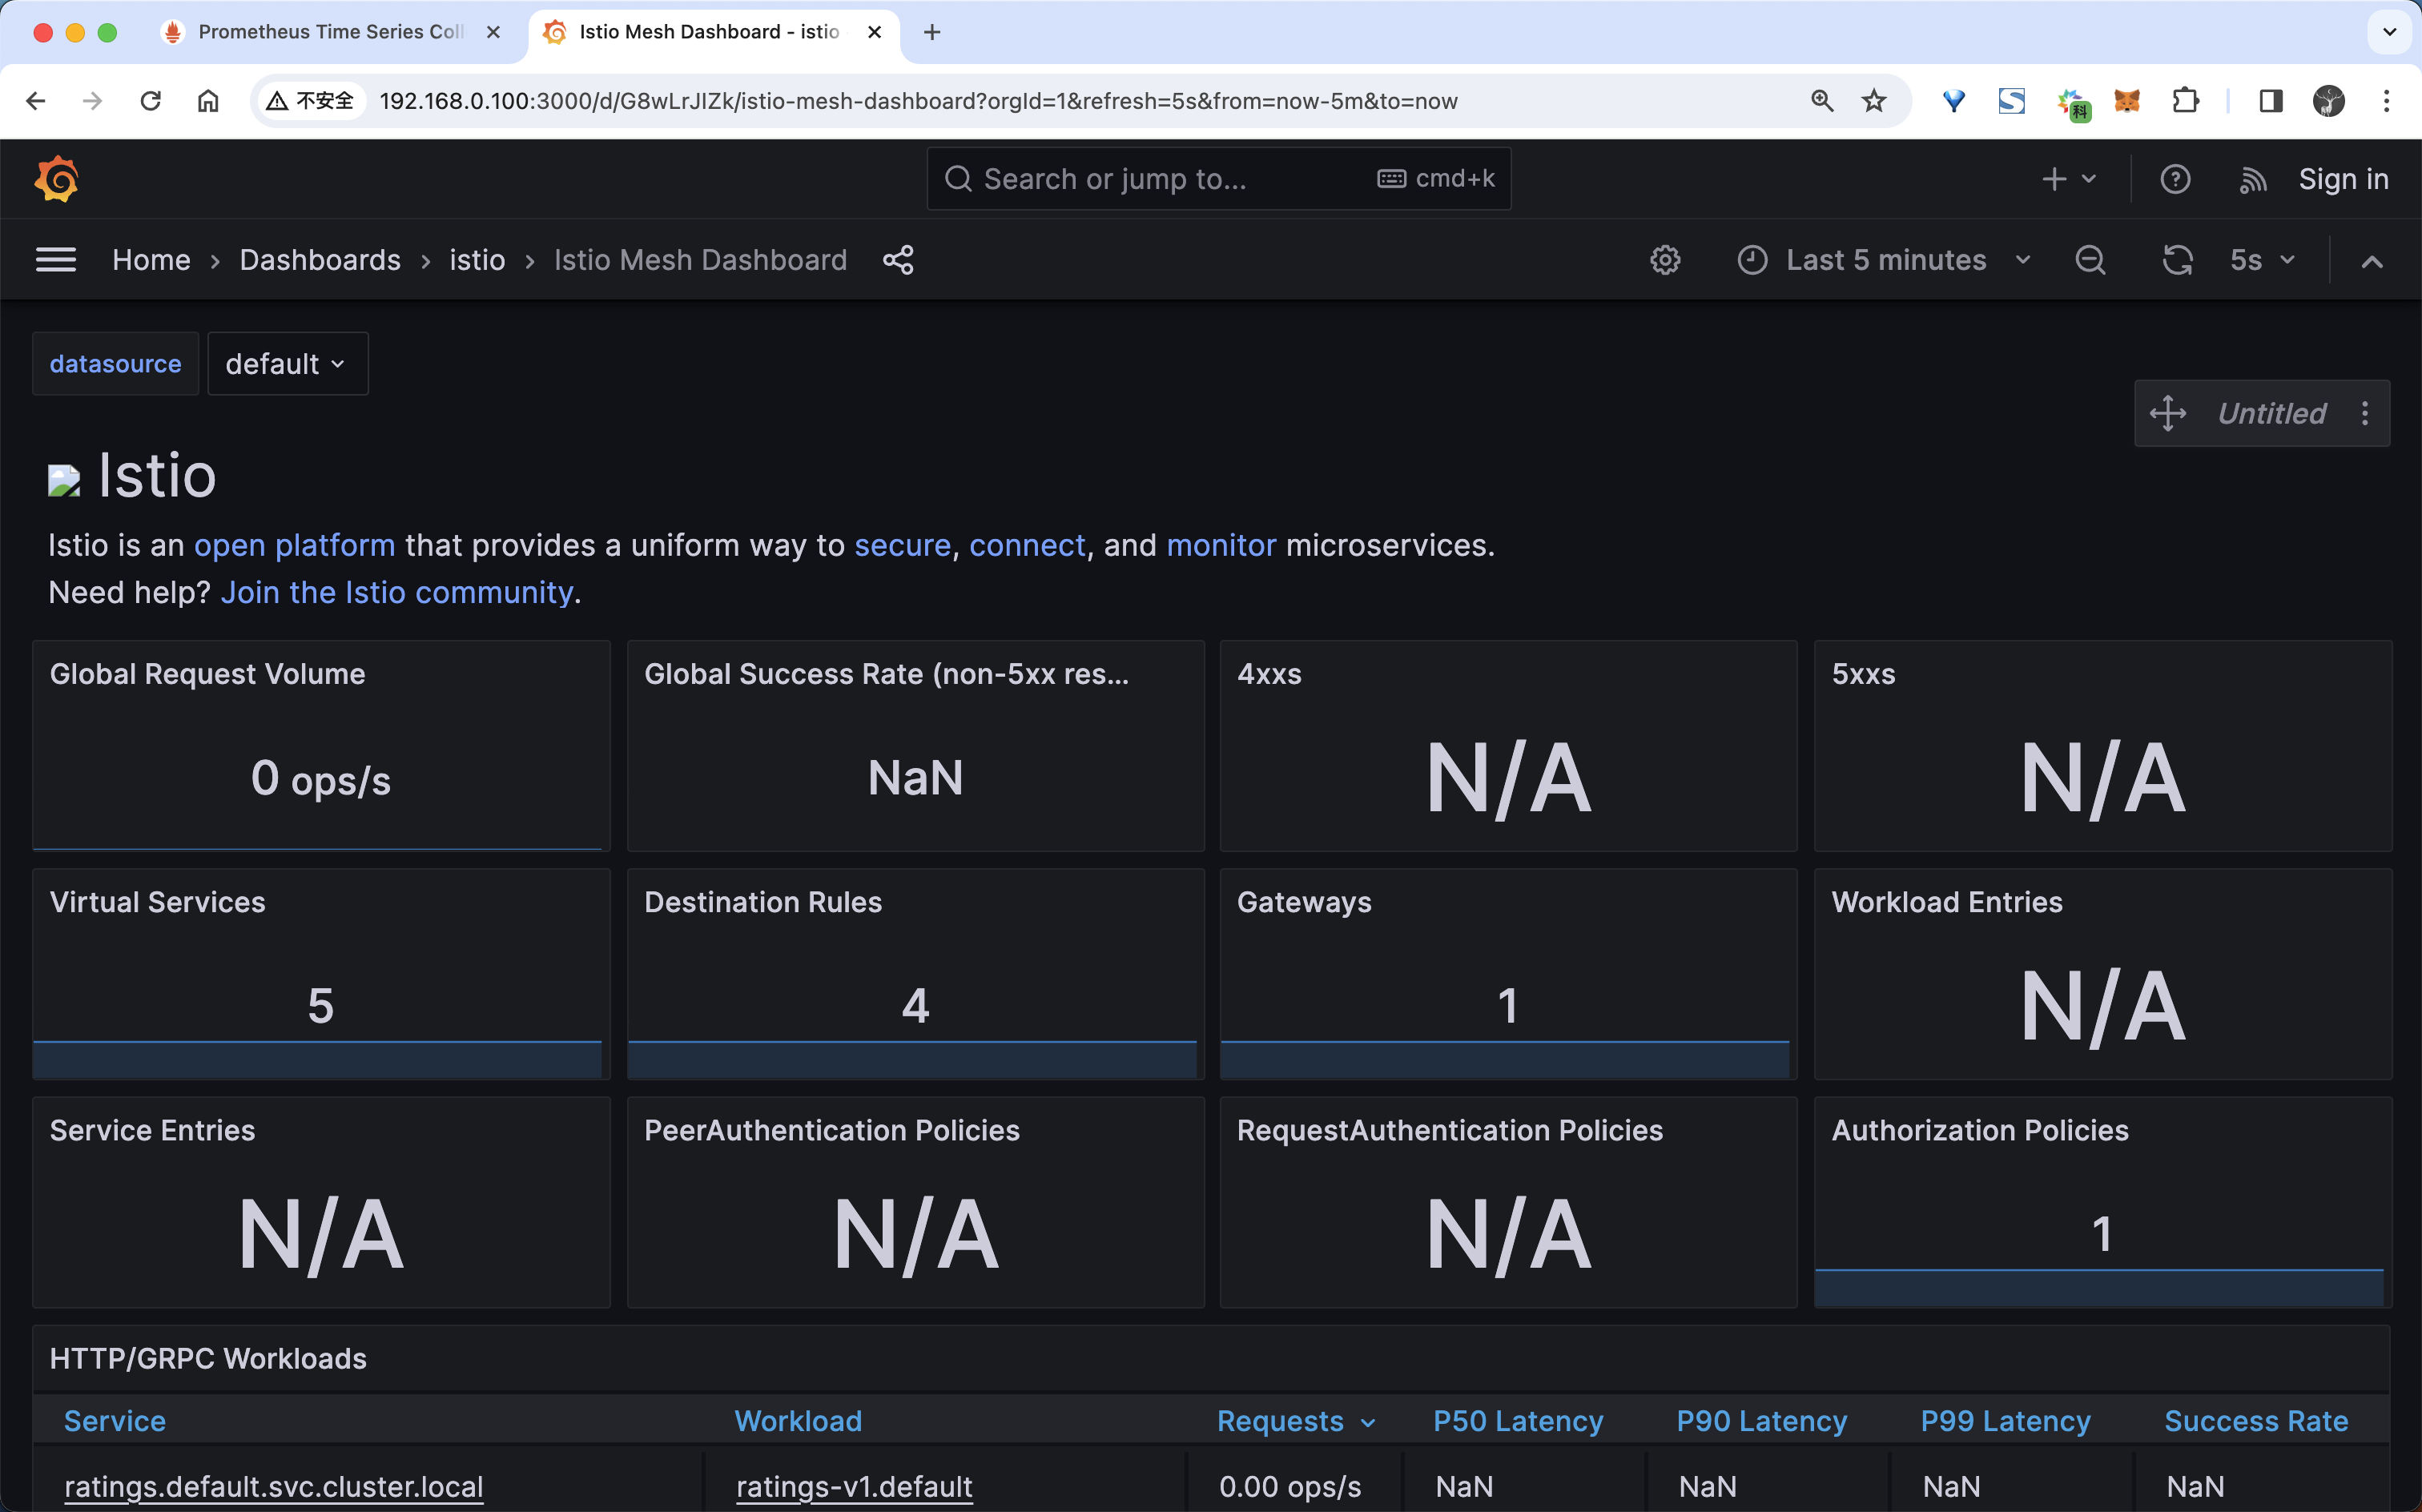
从图中可以看出现在有一些数据,但是并不是很多,这是因为我们现在还没产生一些流量请求。
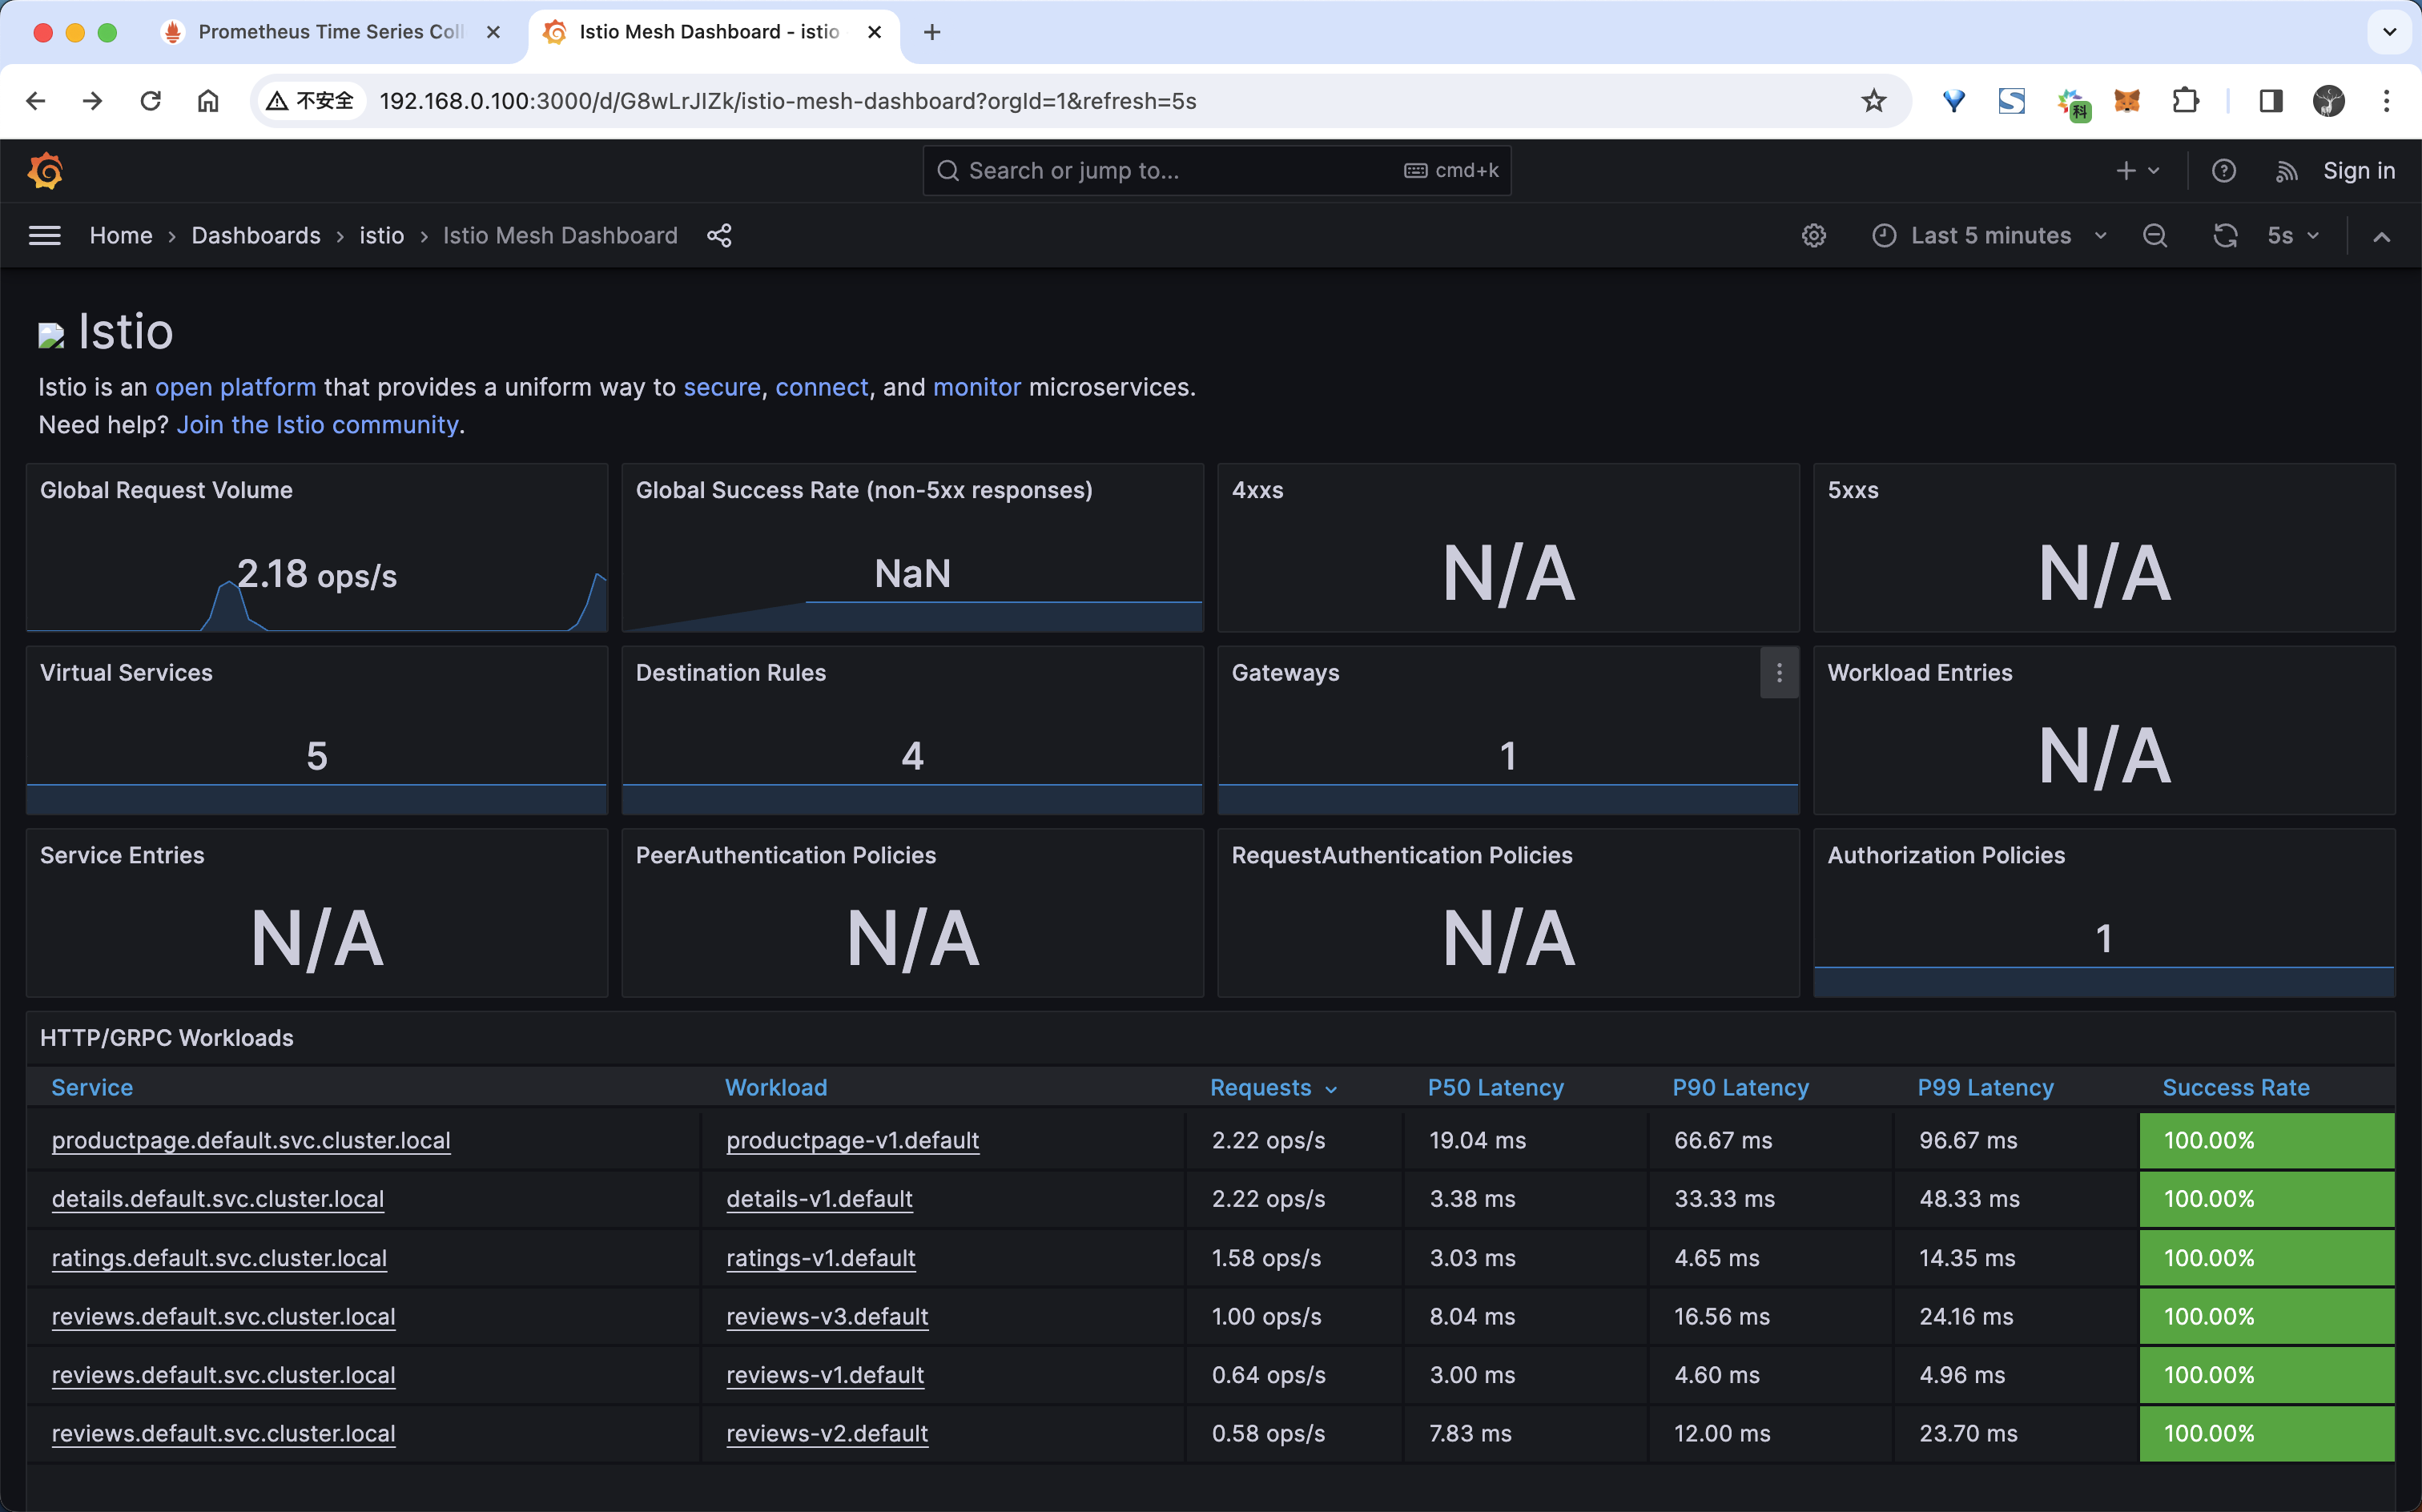
- 下面我们可以用下面的命令向 productpage 服务发送 100 个请求:
for i in $(seq 1 100); do curl -s -o /dev/null "http://$GATEWAY_URL/productpage"; done- 然后我们再次查看 Istio Mesh Dashboard,它应该反映所产生的流量,如下所示:
- 当然除此之外我们也可以查看到 Service 或者 Workload 的指标,比如我们可以查看
productpage工作负载的指标:
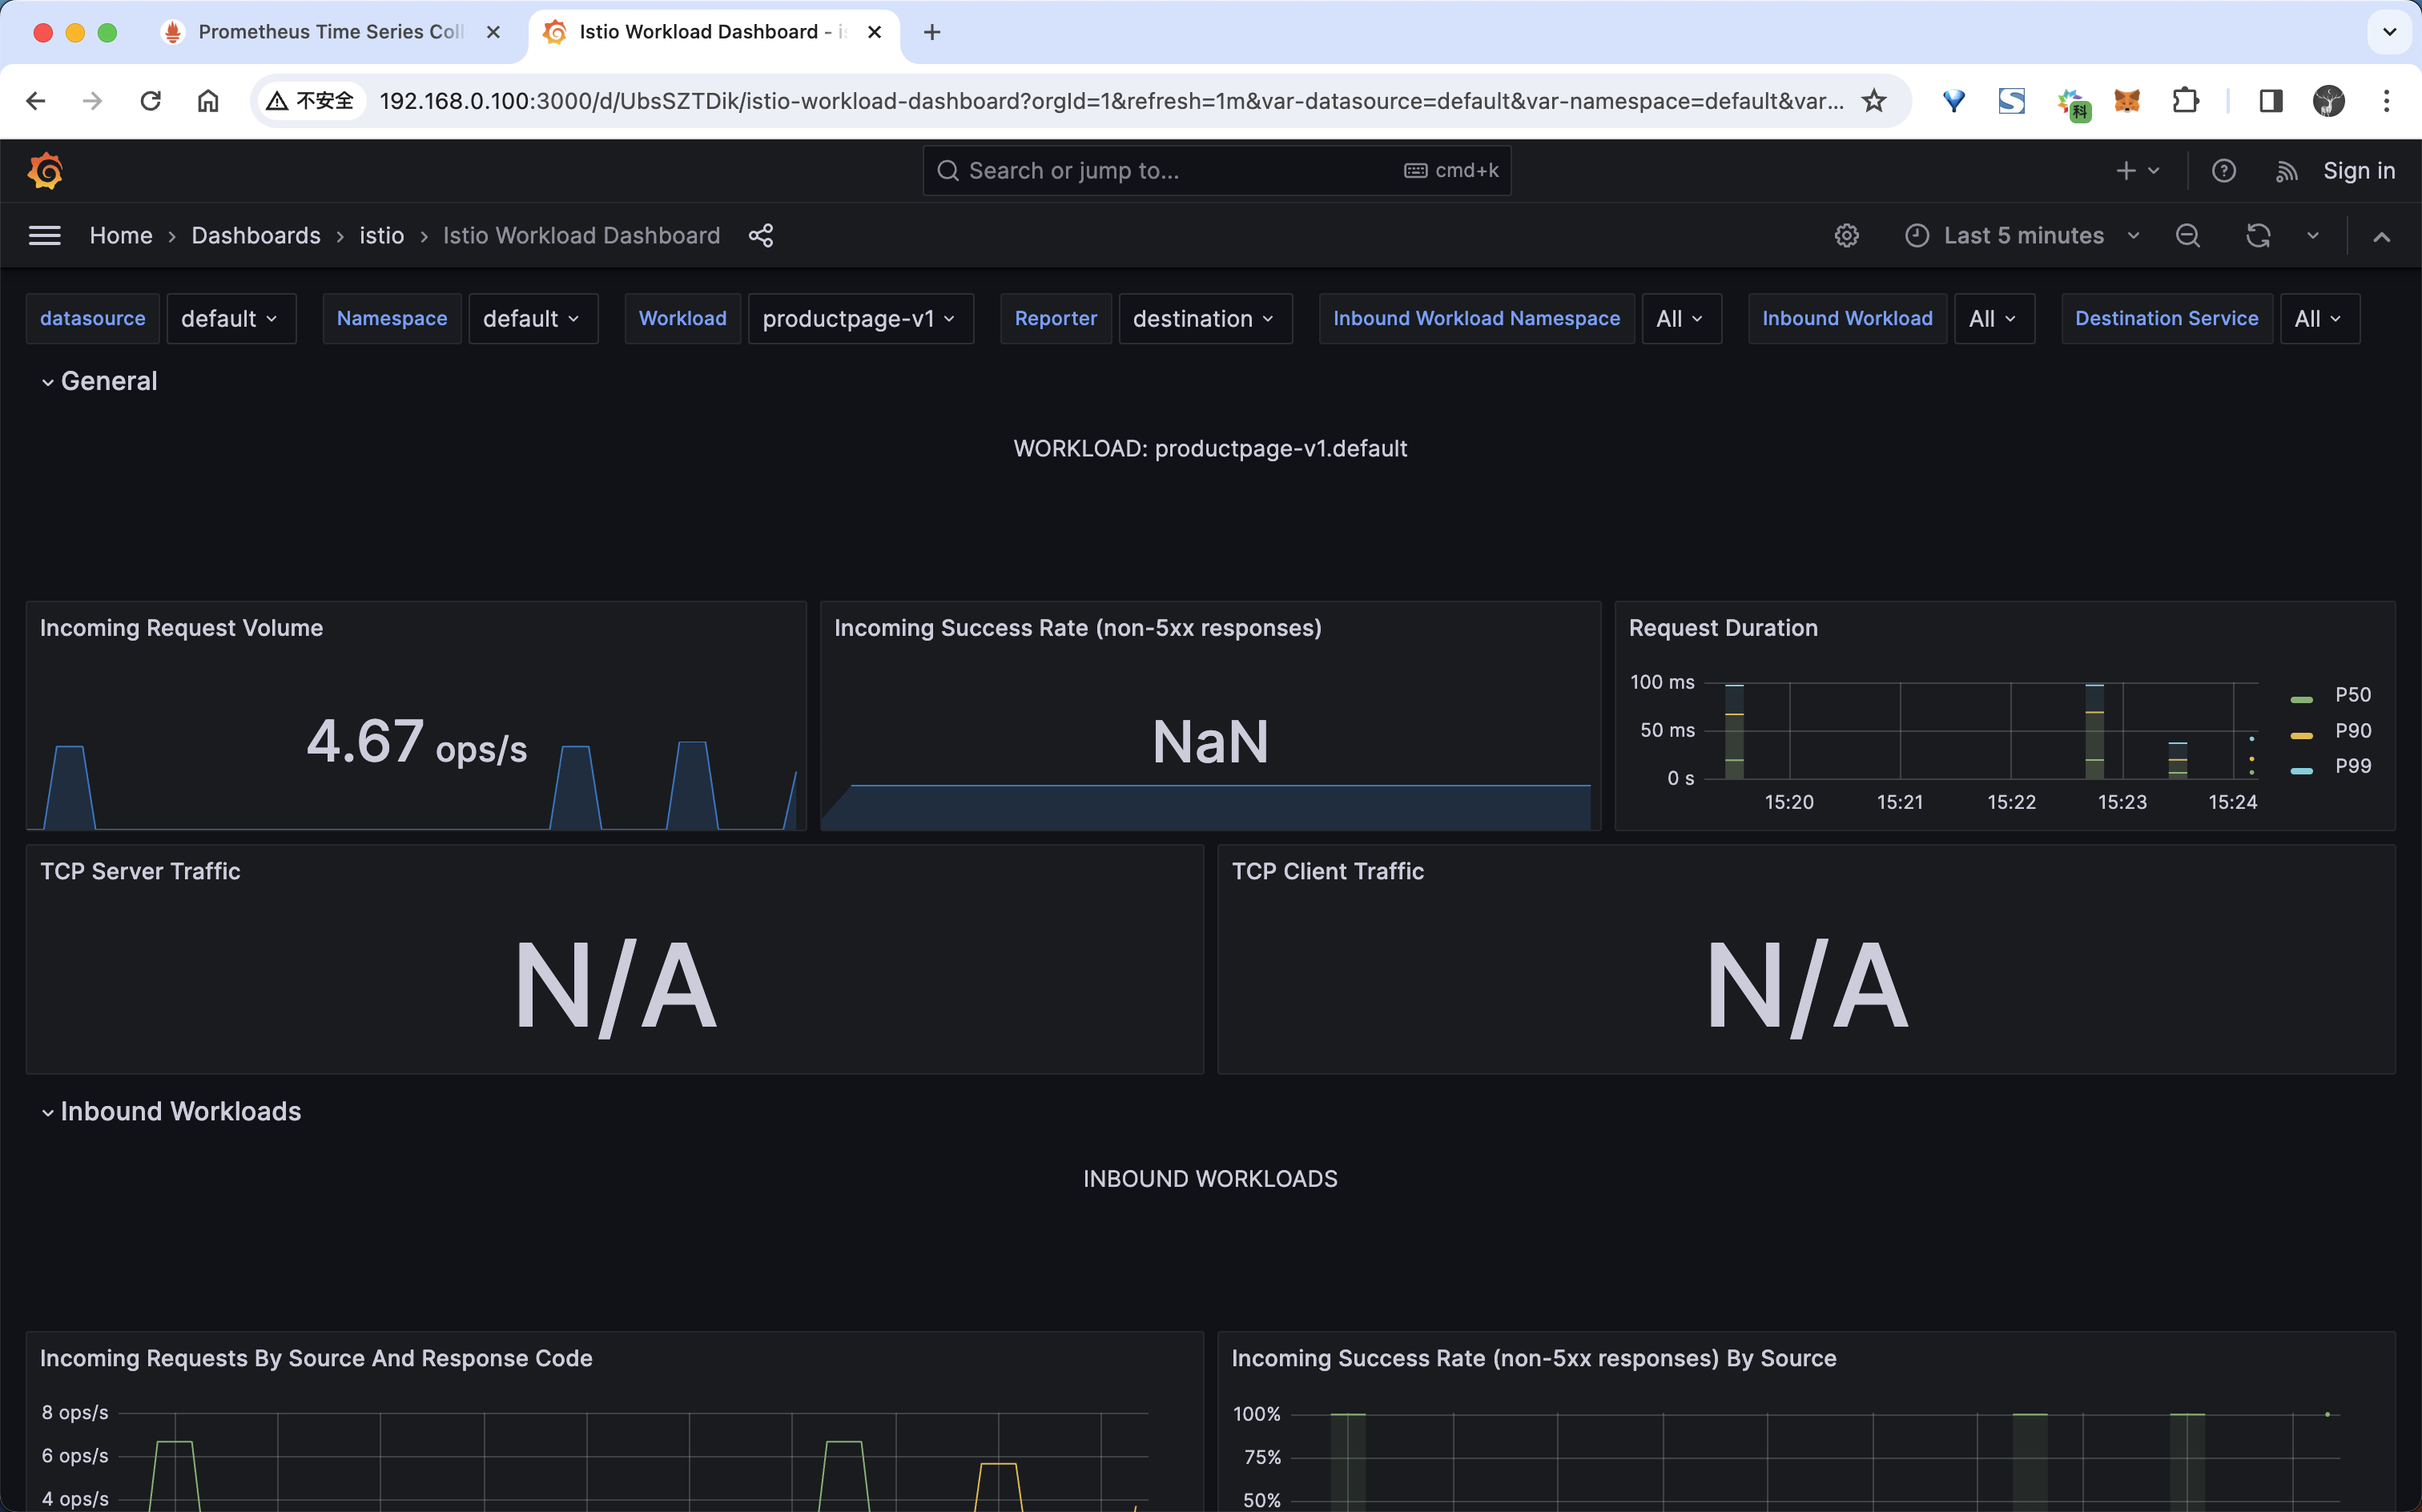
这里给出了每一个工作负载,以及该工作负载的入站工作负载(将请求发送到该工作负载的工作负载)和出站服务(此工作负载向其发送请求的服务)的详细指标。
Istio Dashboard 主要包括三个主要部分:
- 网格摘要视图:这部分提供网格的全局摘要视图,并显示网格中(HTTP/gRPC 和 TCP)的工作负载。
- 单独的服务视图:这部分提供关于网格中每个单独的(HTTP/gRPC 和 TCP)服务的请求和响应指标。这部分也提供关于该服务的客户端和服务工作负载的指标。
- 单独的工作负载视图:这部分提供关于网格中每个单独的(HTTP/gRPC 和 TCP)工作负载的请求和响应指标。这部分也提供关于该工作负载的入站工作负载和出站服务的指标。
指标采集原理
从上面的例子我们可以看出当我们安装了 Istio 的 Prometheus 插件后,Istio 就会自动收集一些指标,但是我们并没有做任何的配置,那么 Istio 是如何收集指标的呢?如果我们想使用我们自己的 Prometheus 来收集指标,那么我们应该如何配置呢?
- 首先我们需要去查看下 Istio 的 Prometheus 插件的配置,通过
cat samples/addons/prometheus.yaml命令查看配置文件,如下所示:
# Source: prometheus/templates/service.yaml
apiVersion: v1
kind: Service
metadata:
  labels:
    component: "server"
    app: prometheus
    release: prometheus
    chart: prometheus-19.6.1
    heritage: Helm
  name: prometheus
  namespace: istio-system
spec:
  ports:
    - name: http
      port: 9090
      protocol: TCP
      targetPort: 9090
  selector:
    component: "server"
    app: prometheus
    release: prometheus
  sessionAffinity: None
  type: "ClusterIP"
---
# Source: prometheus/templates/deploy.yaml
apiVersion: apps/v1
kind: Deployment
metadata:
  labels:
    component: "server"
    app: prometheus
    release: prometheus
    chart: prometheus-19.6.1
    heritage: Helm
  name: prometheus
  namespace: istio-system
spec:
  selector:
    matchLabels:
      component: "server"
      app: prometheus
      release: prometheus
  replicas: 1
  strategy:
    type: Recreate
    rollingUpdate: null
  template:
    metadata:
      labels:
        component: "server"
        app: prometheus
        release: prometheus
        chart: prometheus-19.6.1
        heritage: Helm
        sidecar.istio.io/inject: "false"
    spec:
      enableServiceLinks: true
      serviceAccountName: prometheus
      containers:
        - name: prometheus-server-configmap-reload
          image: "jimmidyson/configmap-reload:v0.8.0"
          imagePullPolicy: "IfNotPresent"
          args:
            - --volume-dir=/etc/config
            - --webhook-url=http://127.0.0.1:9090/-/reload
          resources: {}
          volumeMounts:
            - name: config-volume
              mountPath: /etc/config
              readOnly: true
        - name: prometheus-server
          image: "prom/prometheus:v2.41.0"
          imagePullPolicy: "IfNotPresent"
          args:
            - --storage.tsdb.retention.time=15d
            - --config.file=/etc/config/prometheus.yml ##配置文件
            - --storage.tsdb.path=/data
            - --web.console.libraries=/etc/prometheus/console_libraries
            - --web.console.templates=/etc/prometheus/consoles
            - --web.enable-lifecycle
          ports:
            - containerPort: 9090
          readinessProbe:
            httpGet:
              path: /-/ready
              port: 9090
              scheme: HTTP
            initialDelaySeconds: 0
            periodSeconds: 5
            timeoutSeconds: 4
            failureThreshold: 3
            successThreshold: 1
          livenessProbe:
            httpGet:
              path: /-/healthy
              port: 9090
              scheme: HTTP
            initialDelaySeconds: 30
            periodSeconds: 15
            timeoutSeconds: 10
            failureThreshold: 3
            successThreshold: 1
          resources: {}
          volumeMounts:
            - name: config-volume
              mountPath: /etc/config
            - name: storage-volume
              mountPath: /data
              subPath: ""
      dnsPolicy: ClusterFirst
      securityContext:
        fsGroup: 65534
        runAsGroup: 65534
        runAsNonRoot: true
        runAsUser: 65534
      terminationGracePeriodSeconds: 300
      volumes:
        - name: config-volume
          configMap:
            name: prometheus
        - name: storage-volume
          emptyDir: {} ##临时的
# 省略了部分配置从上面的资源清单中可以看出 Prometheus 服务的核心配置文件为 --config.file=/etc/config/prometheus.yml,而该配置文件是通过上面的 prometheus 这个 ConfigMap 以 volume 形式挂载到容器中的。
- 所以我们重点是查看这个 ConfigMap 的配置,如下所示:
# Source: prometheus/templates/cm.yaml
apiVersion: v1
kind: ConfigMap
metadata:
  labels:
    component: "server"
    app: prometheus
    release: prometheus
    chart: prometheus-19.6.1
    heritage: Helm
  name: prometheus
  namespace: istio-system
data:
  allow-snippet-annotations: "false"
  alerting_rules.yml: |
    {}
  alerts: |
    {}
  prometheus.yml: |
    global:
      evaluation_interval: 1m
      scrape_interval: 15s
      scrape_timeout: 10s
    rule_files:
    - /etc/config/recording_rules.yml
    - /etc/config/alerting_rules.yml
    - /etc/config/rules
    - /etc/config/alerts
    scrape_configs:
    - job_name: prometheus
      static_configs:
      - targets:
        - localhost:9090
    - bearer_token_file: /var/run/secrets/kubernetes.io/serviceaccount/token
      job_name: kubernetes-apiservers
      kubernetes_sd_configs:
      - role: endpoints
      relabel_configs:
      - action: keep
        regex: default;kubernetes;https
        source_labels:
        - __meta_kubernetes_namespace
        - __meta_kubernetes_service_name
        - __meta_kubernetes_endpoint_port_name
      scheme: https
      tls_config:
        ca_file: /var/run/secrets/kubernetes.io/serviceaccount/ca.crt
        insecure_skip_verify: true
    - bearer_token_file: /var/run/secrets/kubernetes.io/serviceaccount/token
      job_name: kubernetes-nodes
      kubernetes_sd_configs:
      - role: node
      relabel_configs:
      - action: labelmap
        regex: __meta_kubernetes_node_label_(.+)
      - replacement: kubernetes.default.svc:443
        target_label: __address__
      - regex: (.+)
        replacement: /api/v1/nodes/$1/proxy/metrics
        source_labels:
        - __meta_kubernetes_node_name
        target_label: __metrics_path__
      scheme: https
      tls_config:
        ca_file: /var/run/secrets/kubernetes.io/serviceaccount/ca.crt
        insecure_skip_verify: true
    - bearer_token_file: /var/run/secrets/kubernetes.io/serviceaccount/token
      job_name: kubernetes-nodes-cadvisor
      kubernetes_sd_configs:
      - role: node
      relabel_configs:
      - action: labelmap
        regex: __meta_kubernetes_node_label_(.+)
      - replacement: kubernetes.default.svc:443
        target_label: __address__
      - regex: (.+)
        replacement: /api/v1/nodes/$1/proxy/metrics/cadvisor
        source_labels:
        - __meta_kubernetes_node_name
        target_label: __metrics_path__
      scheme: https
      tls_config:
        ca_file: /var/run/secrets/kubernetes.io/serviceaccount/ca.crt
        insecure_skip_verify: true
    - honor_labels: true
      job_name: kubernetes-service-endpoints
      kubernetes_sd_configs:
      - role: endpoints
      relabel_configs:
      - action: keep
        regex: true
        source_labels:
        - __meta_kubernetes_service_annotation_prometheus_io_scrape
      - action: drop
        regex: true
        source_labels:
        - __meta_kubernetes_service_annotation_prometheus_io_scrape_slow
      - action: replace
        regex: (https?)
        source_labels:
        - __meta_kubernetes_service_annotation_prometheus_io_scheme
        target_label: __scheme__
      - action: replace
        regex: (.+)
        source_labels:
        - __meta_kubernetes_service_annotation_prometheus_io_path
        target_label: __metrics_path__
      - action: replace
        regex: (.+?)(?::\d+)?;(\d+)
        replacement: $1:$2
        source_labels:
        - __address__
        - __meta_kubernetes_service_annotation_prometheus_io_port
        target_label: __address__
      - action: labelmap
        regex: __meta_kubernetes_service_annotation_prometheus_io_param_(.+)
        replacement: __param_$1
      - action: labelmap
        regex: __meta_kubernetes_service_label_(.+)
      - action: replace
        source_labels:
        - __meta_kubernetes_namespace
        target_label: namespace
      - action: replace
        source_labels:
        - __meta_kubernetes_service_name
        target_label: service
      - action: replace
        source_labels:
        - __meta_kubernetes_pod_node_name
        target_label: node
    - honor_labels: true
      job_name: kubernetes-service-endpoints-slow
      kubernetes_sd_configs:
      - role: endpoints
      relabel_configs:
      - action: keep
        regex: true
        source_labels:
        - __meta_kubernetes_service_annotation_prometheus_io_scrape_slow
      - action: replace
        regex: (https?)
        source_labels:
        - __meta_kubernetes_service_annotation_prometheus_io_scheme
        target_label: __scheme__
      - action: replace
        regex: (.+)
        source_labels:
        - __meta_kubernetes_service_annotation_prometheus_io_path
        target_label: __metrics_path__
      - action: replace
        regex: (.+?)(?::\d+)?;(\d+)
        replacement: $1:$2
        source_labels:
        - __address__
        - __meta_kubernetes_service_annotation_prometheus_io_port
        target_label: __address__
      - action: labelmap
        regex: __meta_kubernetes_service_annotation_prometheus_io_param_(.+)
        replacement: __param_$1
      - action: labelmap
        regex: __meta_kubernetes_service_label_(.+)
      - action: replace
        source_labels:
        - __meta_kubernetes_namespace
        target_label: namespace
      - action: replace
        source_labels:
        - __meta_kubernetes_service_name
        target_label: service
      - action: replace
        source_labels:
        - __meta_kubernetes_pod_node_name
        target_label: node
      scrape_interval: 5m
      scrape_timeout: 30s
    - honor_labels: true
      job_name: prometheus-pushgateway
      kubernetes_sd_configs:
      - role: service
      relabel_configs:
      - action: keep
        regex: pushgateway
        source_labels:
        - __meta_kubernetes_service_annotation_prometheus_io_probe
    - honor_labels: true
      job_name: kubernetes-services
      kubernetes_sd_configs:
      - role: service
      metrics_path: /probe
      params:
        module:
        - http_2xx
      relabel_configs:
      - action: keep
        regex: true
        source_labels:
        - __meta_kubernetes_service_annotation_prometheus_io_probe
      - source_labels:
        - __address__
        target_label: __param_target
      - replacement: blackbox
        target_label: __address__
      - source_labels:
        - __param_target
        target_label: instance
      - action: labelmap
        regex: __meta_kubernetes_service_label_(.+)
      - source_labels:
        - __meta_kubernetes_namespace
        target_label: namespace
      - source_labels:
        - __meta_kubernetes_service_name
        target_label: service
    - honor_labels: true
      job_name: kubernetes-pods
      kubernetes_sd_configs:
      - role: pod
      relabel_configs:
      - action: keep
        regex: true
        source_labels:
        - __meta_kubernetes_pod_annotation_prometheus_io_scrape
      - action: drop
        regex: true
        source_labels:
        - __meta_kubernetes_pod_annotation_prometheus_io_scrape_slow
      - action: replace
        regex: (https?)
        source_labels:
        - __meta_kubernetes_pod_annotation_prometheus_io_scheme
        target_label: __scheme__
      - action: replace
        regex: (.+)
        source_labels:
        - __meta_kubernetes_pod_annotation_prometheus_io_path
        target_label: __metrics_path__
      - action: replace
        regex: (\d+);(([A-Fa-f0-9]{1,4}::?){1,7}[A-Fa-f0-9]{1,4})
        replacement: '[$2]:$1'
        source_labels:
        - __meta_kubernetes_pod_annotation_prometheus_io_port
        - __meta_kubernetes_pod_ip
        target_label: __address__
      - action: replace
        regex: (\d+);((([0-9]+?)(\.|$)){4})
        replacement: $2:$1
        source_labels:
        - __meta_kubernetes_pod_annotation_prometheus_io_port
        - __meta_kubernetes_pod_ip
        target_label: __address__
      - action: labelmap
        regex: __meta_kubernetes_pod_annotation_prometheus_io_param_(.+)
        replacement: __param_$1
      - action: labelmap
        regex: __meta_kubernetes_pod_label_(.+)
      - action: replace
        source_labels:
        - __meta_kubernetes_namespace
        target_label: namespace
      - action: replace
        source_labels:
        - __meta_kubernetes_pod_name
        target_label: pod
      - action: drop
        regex: Pending|Succeeded|Failed|Completed
        source_labels:
        - __meta_kubernetes_pod_phase
    - honor_labels: true
      job_name: kubernetes-pods-slow
      kubernetes_sd_configs:
      - role: pod
      relabel_configs:
      - action: keep
        regex: true
        source_labels:
        - __meta_kubernetes_pod_annotation_prometheus_io_scrape_slow
      - action: replace
        regex: (https?)
        source_labels:
        - __meta_kubernetes_pod_annotation_prometheus_io_scheme
        target_label: __scheme__
      - action: replace
        regex: (.+)
        source_labels:
        - __meta_kubernetes_pod_annotation_prometheus_io_path
        target_label: __metrics_path__
      - action: replace
        regex: (\d+);(([A-Fa-f0-9]{1,4}::?){1,7}[A-Fa-f0-9]{1,4})
        replacement: '[$2]:$1'
        source_labels:
        - __meta_kubernetes_pod_annotation_prometheus_io_port
        - __meta_kubernetes_pod_ip
        target_label: __address__
      - action: replace
        regex: (\d+);((([0-9]+?)(\.|$)){4})
        replacement: $2:$1
        source_labels:
        - __meta_kubernetes_pod_annotation_prometheus_io_port
        - __meta_kubernetes_pod_ip
        target_label: __address__
      - action: labelmap
        regex: __meta_kubernetes_pod_annotation_prometheus_io_param_(.+)
        replacement: __param_$1
      - action: labelmap
        regex: __meta_kubernetes_pod_label_(.+)
      - action: replace
        source_labels:
        - __meta_kubernetes_namespace
        target_label: namespace
      - action: replace
        source_labels:
        - __meta_kubernetes_pod_name
        target_label: pod
      - action: drop
        regex: Pending|Succeeded|Failed|Completed
        source_labels:
        - __meta_kubernetes_pod_phase
      scrape_interval: 5m
      scrape_timeout: 30s
  recording_rules.yml: |
    {}
  rules: |
    {}
---这个配置文件中描述了 6 个指标抓取任务的配置:
prometheus:抓取 Prometheus 服务自身的指标。kubernetes-apiservers:抓取 Kubernetes API 服务器的指标。kubernetes-nodes:抓取 Kubernetes 节点的指标。kubernetes-nodes-cadvisor:抓取 Kubernetes 节点的 cadvisor 指标,主要包括容器的 CPU、内存、网络、磁盘等指标。kubernetes-service-endpoints:抓取 Kubernetes 服务端点的指标。kubernetes-pods:抓取 Kubernetes Pod 的指标。
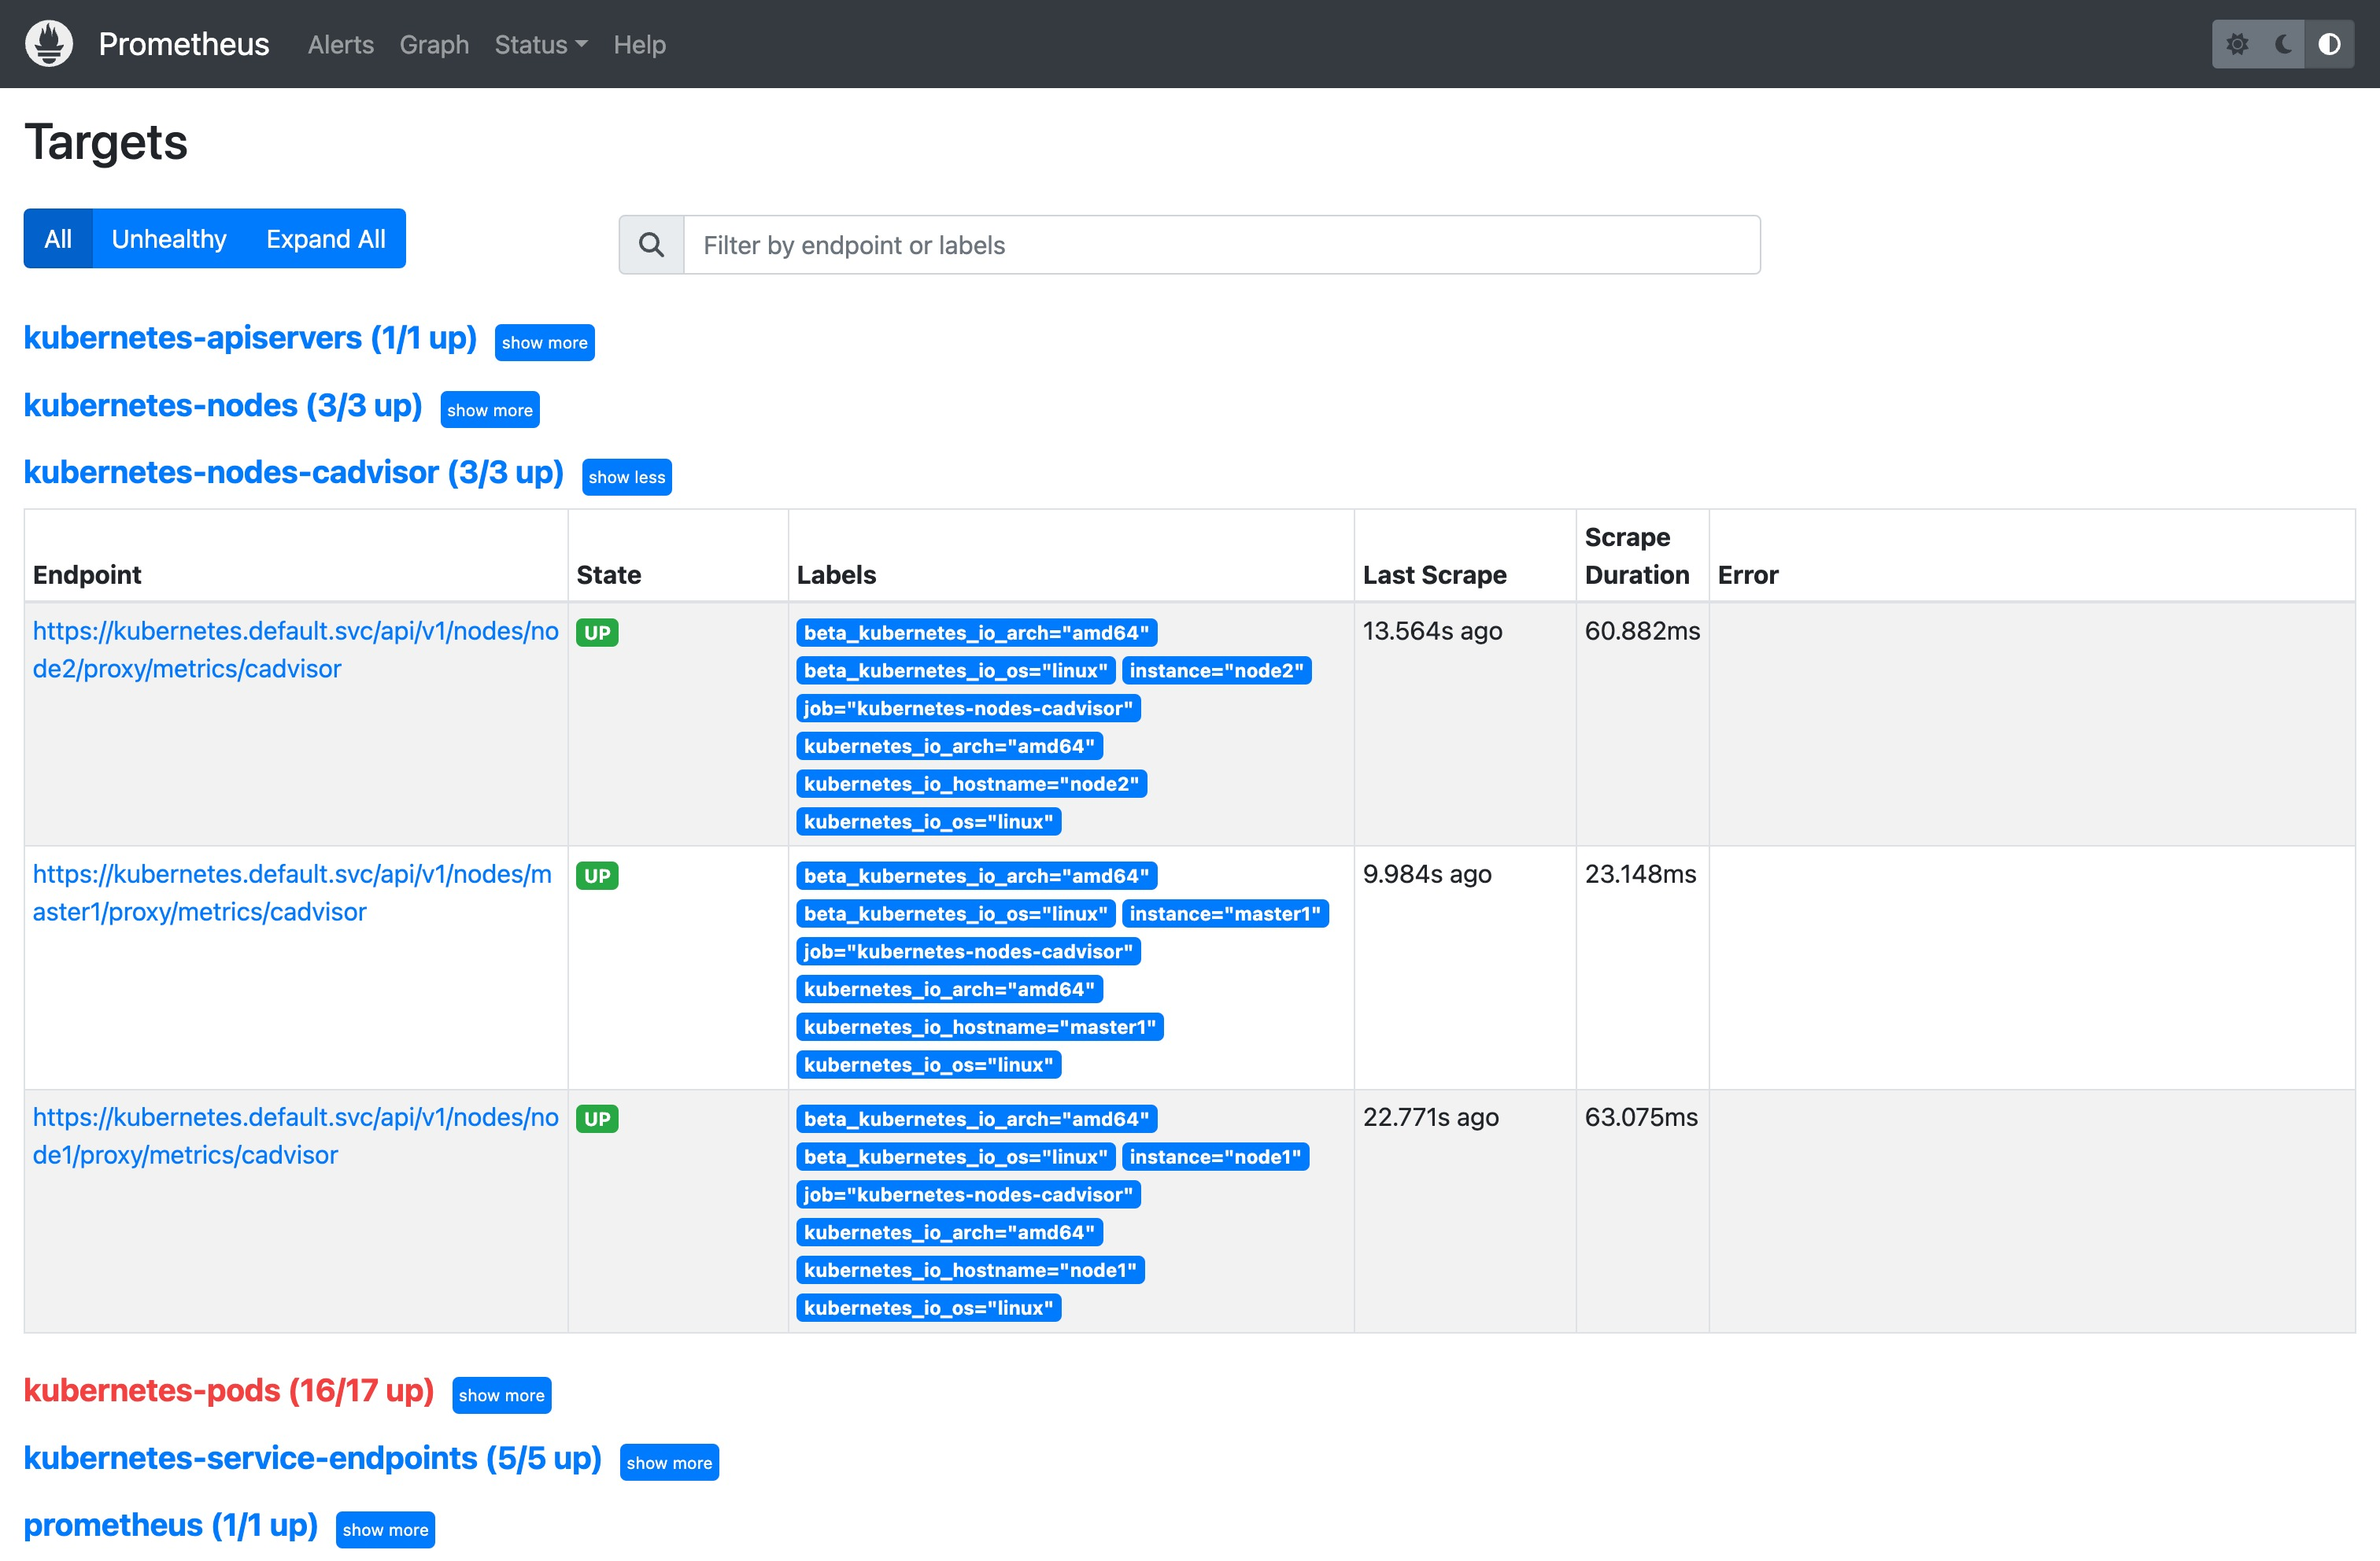
这里我们可以重点关注下 kubernetes-pods 这个指标抓取任务的配置,因为我们大部分的指标数据都是通过 Pod 的 Envoy Sidecar 来提供的。
从配置上可以看到这是基于 pod 的服务发现方式:
- 首先只会保留
__meta_kubernetes_pod_annotation_prometheus_io_scrape这个源标签为true的指标数据,这个源标签表示的是如果 Pod 的 annotation 注解中有prometheus.io/scrape标签,且值为true,则会保留该指标数据,否则会丢弃该指标数据 - 然后根据
prometheus.io/scheme注解来配置协议为 http 或者 https - 根据
prometheus.io/path注解来配置抓取路径 - 根据
prometheus.io/port注解来配置抓取端口; - 将
prometheus.io/param注解的值映射为 Prometheus 的标签; - 然后还会将 pod 的标签通过
labelmap映射为 Prometheus 的标签;最后还会将 pod 的 namespace 和 pod 的名称映射为 Prometheus 的标签。 - 最后需要判断 Pod 的 phase 状态,只有当 Pod 的 phase 状态为
Running时才会保留该指标数据,否则会丢弃该指标数据。
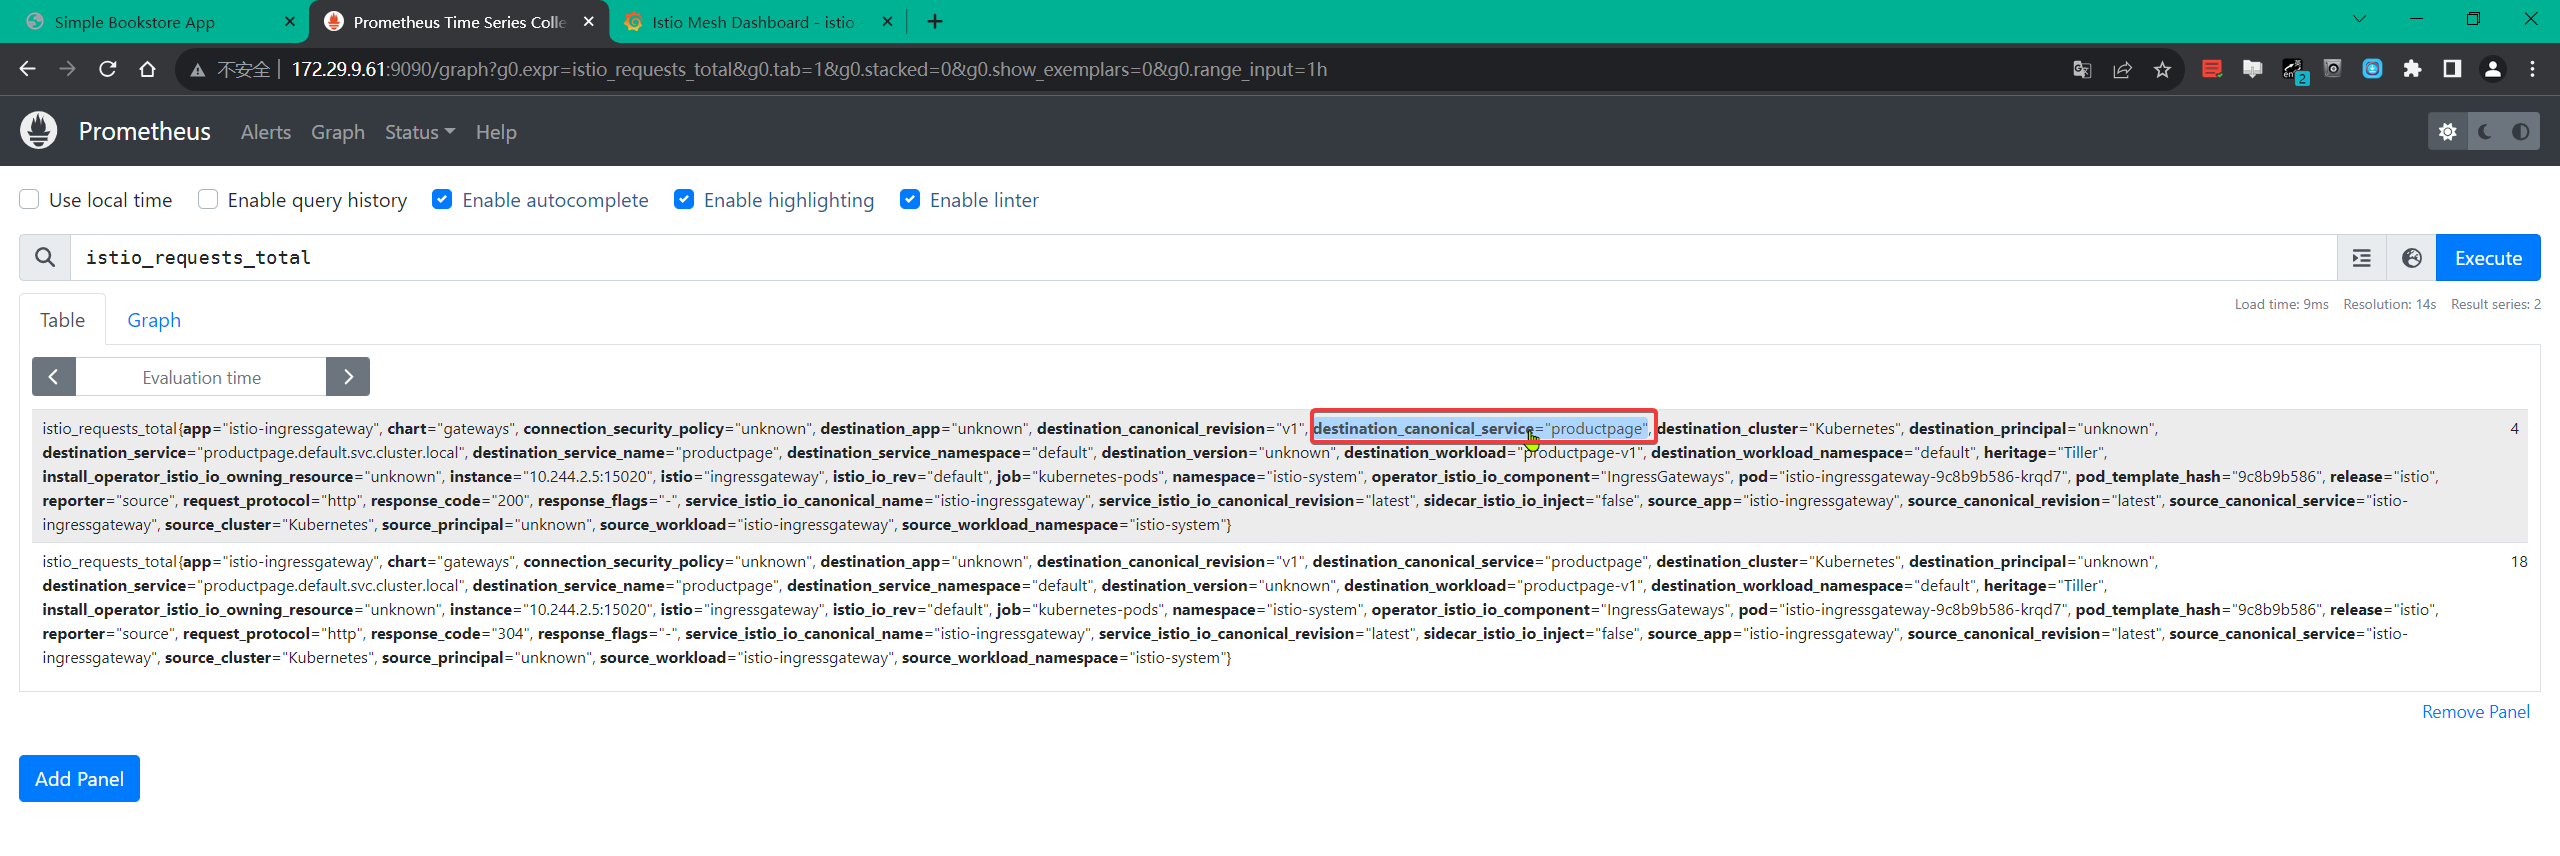
比如我们查询 istio_requests_total{app="productpage", destination_app="details"} 这个指标,如下所示:
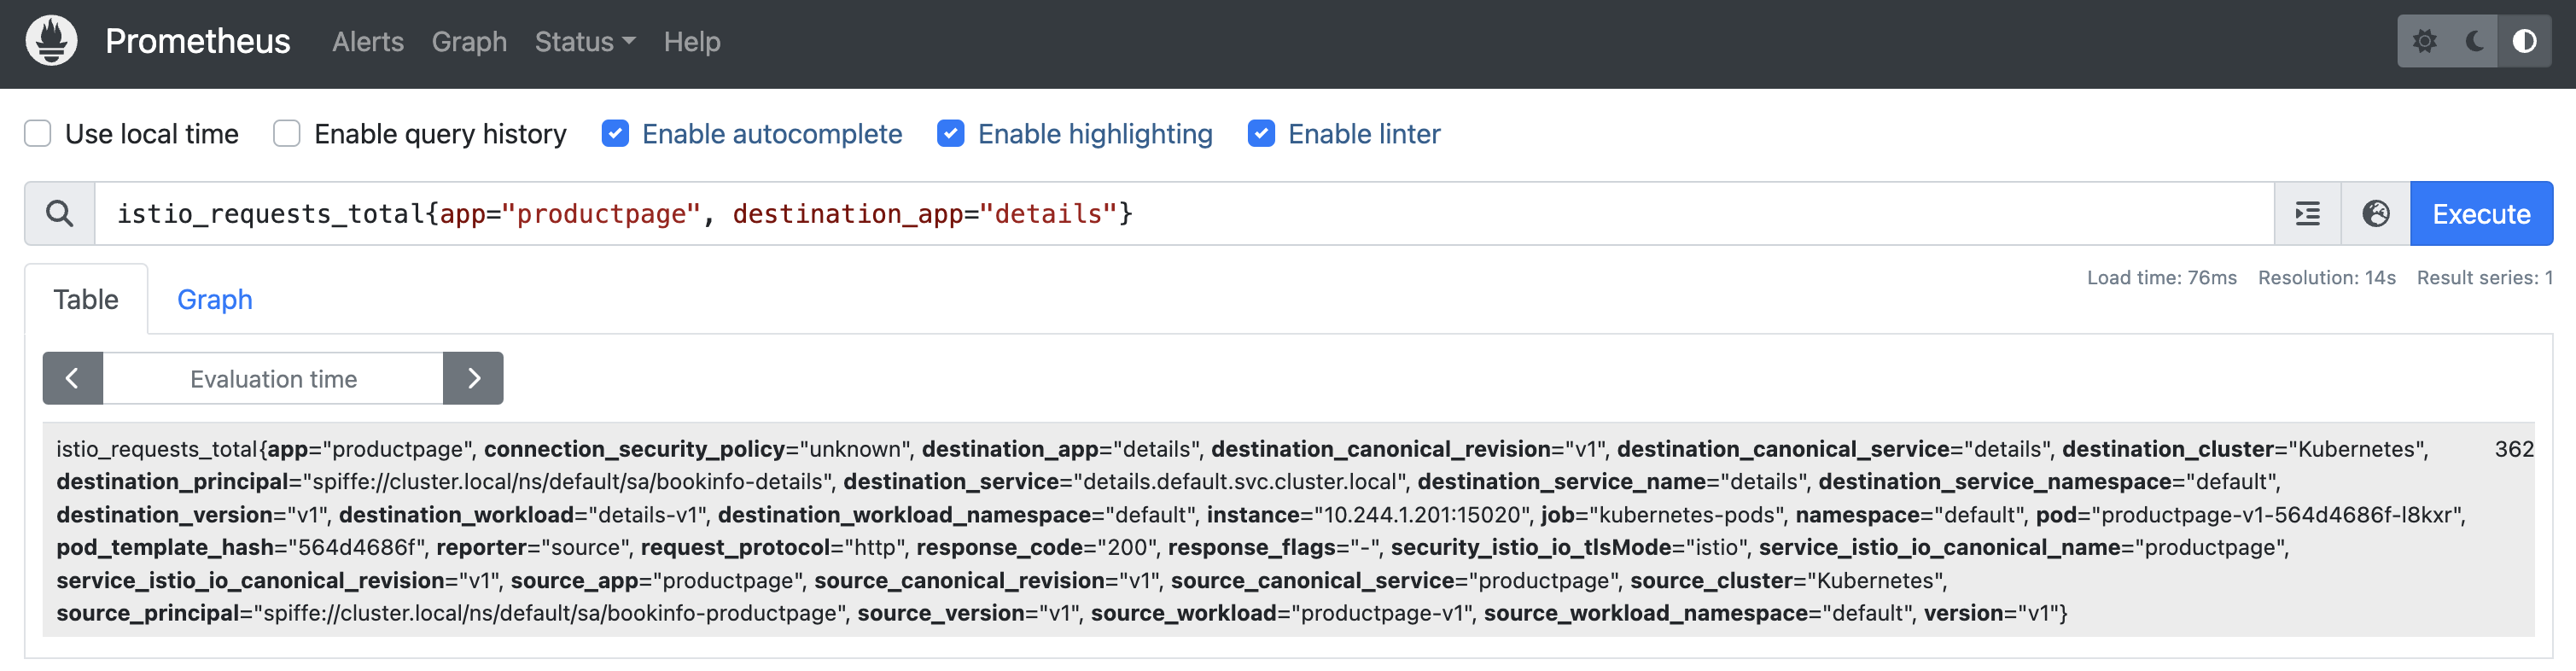
- 该查询语句的查询结果为:
istio_requests_total{
    app="details",
    connection_security_policy="mutual_tls",
    destination_app="details",
    destination_canonical_revision="v1",
    destination_canonical_service="details",
    destination_cluster="Kubernetes",
    destination_principal="spiffe://cluster.local/ns/default/sa/bookinfo-details",
    destination_service="details.default.svc.cluster.local",
    destination_service_name="details",
    destination_service_namespace="default",
    destination_version="v1",
    destination_workload="details-v1",
    destination_workload_namespace="default",
    instance="10.244.2.74:15020",
    job="kubernetes-pods",
    namespace="default",
    pod="details-v1-5f4d584748-9fflw",
    pod_template_hash="5f4d584748",
    reporter="destination",
    request_protocol="http",
    response_code="200",
    response_flags="-",
    security_istio_io_tlsMode="istio",
    service_istio_io_canonical_name="details",
    service_istio_io_canonical_revision="v1",
    source_app="productpage",
    source_canonical_revision="v1",
    source_canonical_service="productpage",
    source_cluster="Kubernetes",
    source_principal="spiffe://cluster.local/ns/default/sa/bookinfo-productpage",
    source_version="v1",
    source_workload="productpage-v1",
    source_workload_namespace="default",
    version="v1"
} 362该查询表示的是从 productpage 服务到 details 服务的请求总次数,从查询结果可以看出该指标就是来源于 job="kubernetes-pods" 这个指标抓取任务,那说明这个指标数据是通过服务发现方式从 Pod 中抓取的。
- 我们可以查看下
productpagePod 的信息,如下所示:
$ kubectl get pods productpage-v1-564d4686f-l8kxr -oyaml
apiVersion: v1
kind: Pod
metadata:
  annotations:
    istio.io/rev: default
    kubectl.kubernetes.io/default-container: productpage
    kubectl.kubernetes.io/default-logs-container: productpage
    prometheus.io/path: /stats/prometheus
    prometheus.io/port: "15020"
    prometheus.io/scrape: "true"
    sidecar.istio.io/status: '{"initContainers":["istio-init"],"containers":["istio-proxy"],"volumes":["workload-socket","credential-socket","workload-certs","istio-envoy","istio-data","istio-podinfo","istio-token","istiod-ca-cert"],"imagePullSecrets":null,"revision":"default"}'
  labels:
    app: productpage
    pod-template-hash: 564d4686f
    security.istio.io/tlsMode: istio
    service.istio.io/canonical-name: productpage
    service.istio.io/canonical-revision: v1
    version: v1
  name: productpage-v1-564d4686f-l8kxr
  namespace: default
spec:
  containers:
  - image: docker.io/istio/examples-bookinfo-productpage-v1:1.18.0
    imagePullPolicy: IfNotPresent
# ......我们从上面的资源清单中可以看到该 Pod 包含如下几个注解:
prometheus.io/path: /stats/prometheusprometheus.io/port: "15020"prometheus.io/scrape: "true"
这些注解就是用来配置 Prometheus 服务发现的,其中 prometheus.io/scrape: "true" 表示该 Pod 的指标数据是需要被抓取的,而 prometheus.io/path: /stats/prometheus 和 prometheus.io/port: "15020" 则是用来配置抓取路径和抓取端口的,当 Prometheus 发现这个 Pod 后根据配置就可以通过 <pod ip>:15020/stats/prometheus 这个路径来抓取该 Pod 的指标数据了,这个路径就是 Envoy Sidecar 提供的 /stats/prometheus 路径,而 15020 则是 Envoy Sidecar 的端口,这个端口是通过 istio-proxy 这个容器配置的静态监听器暴露出来的。
当然定义的标签也被映射为 Prometheus 的标签了,从结果来看除了 Pod 的这些标签之外,Envoy Sidecar 也会自己添加很多相关标签,主要是标明 destination 和 source 的信息,有了这些标签我们就可以很方便的对指标进行查询了。Envoy Sidecar 自行添加的一些主要标签如下所示:
reporter:标识请求指标的上报端,如果指标由服务端 Istio 代理上报,则设置为destination,如果指标由客户端 Istio 代理或网关上报,则设置为source。source_workload:标识源工作负载的名称,如果缺少源信息,则标识为unknown。source_workload_namespace:标识源工作负载的命名空间,如果缺少源信息,则标识为unknown。source_principal:标识流量源的对等主体,当使用对等身份验证时设置。source_app:根据源工作负载的app标签标识源应用程序,如果源信息丢失,则标识为unknown。source_version:标识源工作负载的版本,如果源信息丢失,则标识为unknown。destination_workload:标识目标工作负载的名称,如果目标信息丢失,则标识为unknown。destination_workload_namespace:标识目标工作负载的命名空间,如果目标信息丢失,则标识为unknown。destination_principal:标识流量目标的对等主体,使用对等身份验证时设置。destination_app:它根据目标工作负载的app标签标识目标应用程序,如果目标信息丢失,则标识为unknown。destination_version:标识目标工作负载的版本,如果目标信息丢失,则标识为unknown。destination_service:标识负责传入请求的目标服务主机,例如:details.default.svc.cluster.local。destination_service_name:标识目标服务名称,例如details。destination_service_namespace:标识目标服务的命名空间。request_protocol:标识请求的协议,设置为请求或连接协议。response_code:标识请求的响应代码,此标签仅出现在 HTTP 指标上。connection_security_policy:标识请求的服务认证策略,当 Istio 使用安全策略来保证通信安全时,如果指标由服务端 Istio 代理上报,则将其设置为mutual_tls。如果指标由客户端 Istio 代理上报,由于无法正确填充安全策略,因此将其设置为unknown。response_flags:有关来自代理的响应或连接的其他详细信息。Canonical Service:工作负载属于一个
Canonical服务,而Canonical服务却可以属于多个服务。Canonical 服务具有名称和修订版本,因此会产生以下标签:source_canonical_servicesource_canonical_revisiondestination_canonical_servicedestination_canonical_revisiondestination_cluster:目标工作负载的集群名称,这是由集群安装时的global.multiCluster.clusterName设置的。source_cluster:源工作负载的集群名称,这是由集群安装时的global.multiCluster.clusterName设置的。grpc_response_status: 这标识了gRPC的响应状态,这个标签仅出现在gRPC指标上。
对于 Istio 来说包括 COUNTER 和 DISTRIBUTION 两种指标类型,这两种指标类型对应我们比较熟悉的计数器和直方图。
对于 HTTP,HTTP/2 和 GRPC 通信,Istio 生成以下指标:
- 请求数 (
istio_requests_total): 这都是一个COUNTER类型的指标,用于记录 Istio 代理处理的总请求数。 - 请求时长 (
istio_request_duration_milliseconds): 这是一个DISTRIBUTION类型的指标,用于测量请求的持续时间。 - 请求体大小 (
istio_request_bytes): 这是一个DISTRIBUTION类型的指标,用来测量 HTTP 请求主体大小。 - 响应体大小 (
istio_response_bytes): 这是一个DISTRIBUTION类型的指标,用来测量 HTTP 响应主体大小。 - gRPC 请求消息数 (
istio_request_messages_total): 这是一个COUNTER类型的指标,用于记录从客户端发送的 gRPC 消息总数。 - gRPC 响应消息数 (
istio_response_messages_total): 这是一个COUNTER类型的指标,用于记录从服务端发送的 gRPC 消息总数。
对于 TCP 流量,Istio 生成以下指标:
- TCP 发送字节大小 (
istio_tcp_sent_bytes_total): 这是一个COUNTER类型的指标,用于测量在 TCP 连接情况下响应期间发送的总字节数。 - TCP 接收字节大小 (
istio_tcp_received_bytes_total): 这是一个COUNTER类型的指标,用于测量在 TCP 连接情况下请求期间接收到的总字节数。 - TCP 已打开连接数 (
istio_tcp_connections_opened_total): 这是一个COUNTER类型的指标,用于记录 TCP 已打开的连接总数。 - TCP 已关闭连接数 (
istio_tcp_connections_closed_total): 这是一个COUNTER类型的指标,用于记录 TCP 已关闭的连接总数。
当我们了解了 Istio 指标数据采集的原理后,我们就可以根据自身的需求来定制了,比如在我们的监控系统采样的是 Prometheus Operator 方式,那么也应该知道该如何来配置采集这些指标数据了。
自定义指标
除了 Istio 自带的指标外,我们还可以自定义指标,要自定指标需要用到 Istio 提供的 Telemetry API,该 API 能够灵活地配置指标、访问日志和追踪数据。Telemetry API 现在已经成为 Istio 中的主流 API。
需要注意的是,Telemetry API 无法与
EnvoyFilter一起使用,请查看此问题 issue。
从 Istio 版本 1.18 版本开始,Prometheus 的 EnvoyFilter 默认不会被安装, 而是通过 meshConfig.defaultProviders 来启用它,我们应该使用 Telemetry API 来进一步定制遥测流程,新的 Telemetry API 不但语义更加清晰,功能也一样没少。
对于 Istio 1.18 之前的版本,应该使用以下的 IstioOperator 配置进行安装:
apiVersion: install.istio.io/v1alpha1
kind: IstioOperator
spec:
  values:
    telemetry:
      enabled: true
      v2:
enabled: falseTelemetry 资源对象的定义如下所示:
$ kubectl explain Telemetry.spec
GROUP:      telemetry.istio.io
KIND:       Telemetry
VERSION:    v1alpha1

FIELD: spec <Object>

DESCRIPTION:
    Telemetry configuration for workloads. See more details at:
    https://istio.io/docs/reference/config/telemetry.html

FIELDS:
  accessLogging <[]Object>
    Optional.

  metrics       <[]Object>
    Optional.

  selector      <Object>
    Optional.

  tracing       <[]Object>
Optional.可以看到 Telemetry 资源对象包含了 accessLogging、metrics、selector 和 tracing 四个字段,其中 accessLogging 和 tracing 字段用于配置访问日志和追踪数据,而 metrics 字段用于配置指标数据,selector 字段用于配置哪些工作负载需要采集指标数据。
我们这里先来看下 metrics 字段的配置,该字段的定义如下所示:
$ kubectl explain Telemetry.spec.metrics
GROUP:      telemetry.istio.io
KIND:       Telemetry
VERSION:    v1alpha1

FIELD: metrics <[]Object>

DESCRIPTION:
    Optional.

FIELDS:
  overrides     <[]Object>
    Optional.

  providers     <[]Object>
    Optional.

  reportingInterval     <string>
Optional.可以看到 metrics 字段包含了 overrides、providers 和 reportingInterval 三个字段。
overrides字段用于配置指标数据的采集方式。providers字段用于配置指标数据的提供者,这里一般配置为prometheus。reportingInterval字段用于配置指标数据的上报间隔,可选的。目前仅支持 TCP 度量,但将来可能会将其用于长时间的 HTTP 流。默认持续时间为 5 秒。
1.删除标签
🚩 实战:自定义指标-删除标签-2023.12.4(测试成功)
实验环境:
k8s v1.27.6(containerd://1.6.20)(cni:flannel:v0.22.2)
istio v1.19.3(--set profile=demo)实验软件:
链接:https://pan.baidu.com/s/1pMnJxgL63oTlGFlhrfnXsA?pwd=7yqb 提取码:7yqb 2023.11.5-实战:BookInfo 示例应用-2023.11.5(测试成功)
比如以前需要在 Istio 配置的 meshConfig 部分配置遥测,这种方式不是很方便。比如我们想从 Istio 指标中删除一些标签以减少基数,那么你的配置中可能有这样一个部分:
# istiooperator.yaml
telemetry:
  enabled: true
  v2:
    enabled: true
    prometheus:
      enabled: true
      configOverride:
        outboundSidecar:
          debug: false
          stat_prefix: istio
          metrics:
            - tags_to_remove:
                - destination_canonical_service
...现在我们可以通过 Telemetry API 来配置,如下所示:
#remove-tags.yaml
apiVersion: telemetry.istio.io/v1alpha1
kind: Telemetry
metadata:
  name: remove-tags
  namespace: istio-system
spec:
  metrics:
    - providers:
        - name: prometheus # 指定指标数据的提供者
      overrides:
        - match: # 提供覆盖的范围,可用于选择个别指标,以及生成指标的工作负载模式(服务器和/或客户端)。如果未指定,则overrides 将应用于两种操作模式(客户端和服务器)的所有指标。
            metric: ALL_METRICS # Istio 标准指标之一
            mode: CLIENT_AND_SERVER # 控制选择的指标生成模式:客户端和/或服务端。
          tagOverrides: # 要覆盖的标签列表
            destination_canonical_service:
              operation: REMOVE
# disabled: true # 是否禁用指标在上面的 Telemetry 资源对象中我们指定了一个 metrics 字段,表示用来自定义指标的,然后通过 providers.name 字段指定指标数据的提供者为 prometheus,然后最重要的是 overrides 字段,用于配置指标数据的采集方式。
其中 overrides.match.metric 字段用来指定要覆盖的 Istio 标准指标,支持指标如下所示:
| 名称 | 描述 |
|---|---|
ALL_METRICS | 使用这个枚举表示应将覆盖应用于所有 Istio 默认指标。 |
REQUEST_COUNT | 对应用程序的请求计数器,适用于 HTTP、HTTP/2 和 GRPC 流量。Prometheus 提供商将此指标导出为:istio_requests_total。Stackdriver 提供商将此指标导出为:istio.io/service/server/request_count(服务器模式)istio.io/service/client/request_count(客户端模式) |
REQUEST_DURATION | 请求持续时间的直方图,适用于 HTTP、HTTP/2 和 GRPC 流量。Prometheus 提供商将此指标导出为:istio_request_duration_milliseconds。Stackdriver 提供商将此指标导出为:istio.io/service/server/response_latencies(服务器模式)istio.io/service/client/roundtrip_latencies(客户端模式) |
REQUEST_SIZE | 请求体大小的直方图,适用于 HTTP、HTTP/2 和 GRPC 流量。Prometheus 提供商将此指标导出为:istio_request_bytes。Stackdriver 提供商将此指标导出为:istio.io/service/server/request_bytes(服务器模式)istio.io/service/client/request_bytes(客户端模式) |
RESPONSE_SIZE | 响应体大小的直方图,适用于 HTTP、HTTP/2 和 GRPC 流量。Prometheus 提供商将此指标导出为:istio_response_bytes。Stackdriver 提供商将此指标导出为:istio.io/service/server/response_bytes(服务器模式)istio.io/service/client/response_bytes(客户端模式) |
TCP_OPENED_CONNECTIONS | 工作负载生命周期中打开的 TCP 连接计数器。Prometheus 提供商将此指标导出为:istio_tcp_connections_opened_total。Stackdriver 提供商将此指标导出为:istio.io/service/server/connection_open_count(服务器模式)istio.io/service/client/connection_open_count(客户端模式) |
TCP_CLOSED_CONNECTIONS | 工作负载生命周期中关闭的 TCP 连接计数器。Prometheus 提供商将此指标导出为:istio_tcp_connections_closed_total。Stackdriver 提供商将此指标导出为:istio.io/service/server/connection_close_count(服务器模式)istio.io/service/client/connection_close_count(客户端模式) |
TCP_SENT_BYTES | TCP 连接期间发送的响应字节计数器。Prometheus 提供商将此指标导出为:istio_tcp_sent_bytes_total。Stackdriver 提供商将此指标导出为:istio.io/service/server/sent_bytes_count(服务器模式)istio.io/service/client/sent_bytes_count(客户端模式) |
TCP_RECEIVED_BYTES | TCP 连接期间接收的请求字节计数器。Prometheus 提供商将此指标导出为:istio_tcp_received_bytes_total。Stackdriver 提供商将此指标导出为:istio.io/service/server/received_bytes_count(服务器模式)istio.io/service/client/received_bytes_count(客户端模式) |
GRPC_REQUEST_MESSAGES | 每发送一个 gRPC 消息时递增的客户端计数器。Prometheus 提供商将此指标导出为:istio_request_messages_total |
GRPC_RESPONSE_MESSAGES | 每发送一个 gRPC 消息时递增的服务器计数器。Prometheus 提供商将此指标导出为:istio_response_messages_total |
比如我们这里配置的指标为 ALL_METRICS 则表示要覆盖所有的 Istio 标准指标。
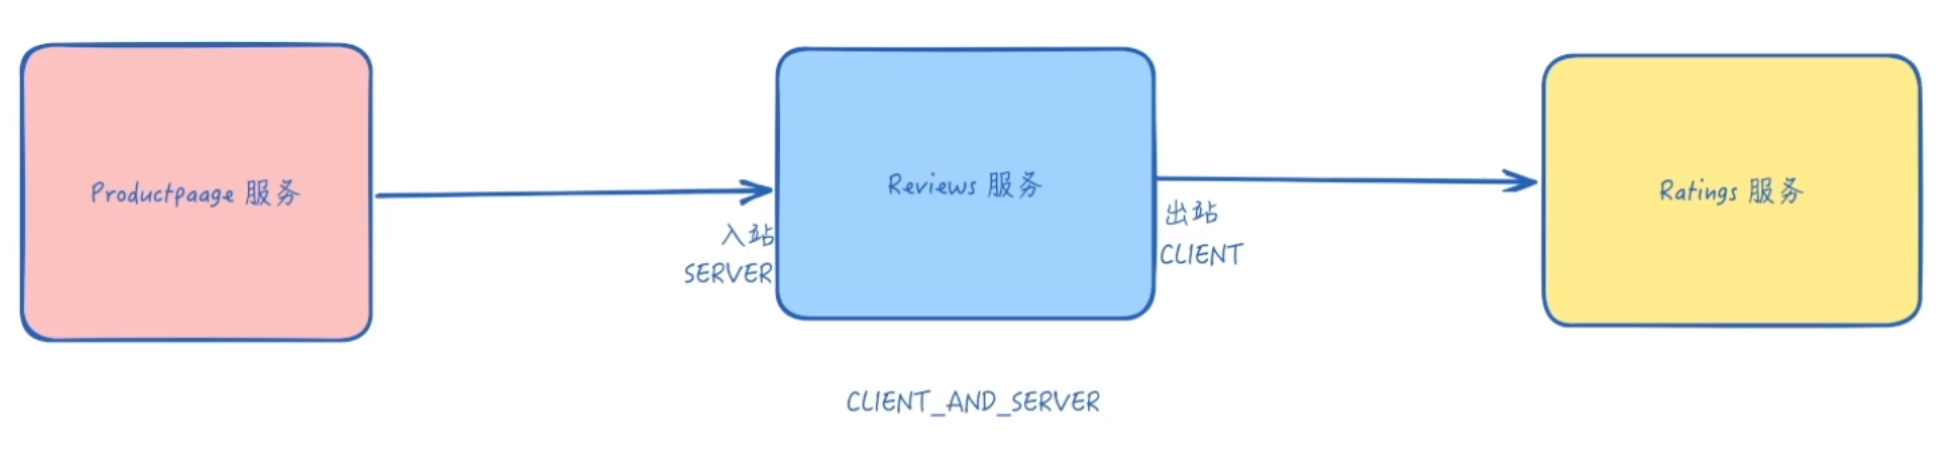
overrides.match.mode 则表示选择网络流量中底层负载的角色,如果负载是流量的目标(从负载的角度看,流量方向是入站),则将其视为作为 SERVER 运行。如果负载是网络流量的源头,则被视为处于 CLIENT 模式(流量从负载出站)。
| 名称 | 描述 |
|---|---|
CLIENT_AND_SERVER | 选择适用于工作负载既是网络流量的源头,又是目标的场景。 |
CLIENT | 选择适用于工作负载是网络流量的源头的场景。 |
SERVER | 选择适用于工作负载是网络流量的目标的场景。 |
另外的 tagOverrides 字段表示要覆盖选定的指标中的标签名称和标签表达式的集合,该字段中的 key 是标签的名称,value 是对标签执行的操作,可以添加、删除标签,或覆盖其默认值。
| 字段 | 类型 | 描述 | 是否必需 |
|---|---|---|---|
operation | Operation | 操作控制是否更新/添加一个标签,或者移除它。 | 否 |
value | string | 当操作为 UPSERT时才考虑值。值是基于属性的 CEL 表达式。例如:string(destination.port)和 request.host。Istio 暴露所有标准的 Envoy 属性。此外,Istio 也将节点元数据作为属性暴露出来。更多信息请参见 自定义指标文档。 | 否 |
对应的操作 Operator 可以配置 UPSERT 和 REMOVE 两个操作:
| 名称 | 描述 |
|---|---|
UPSERT | 使用提供的值表达式插入或更新标签。如果使用 UPSERT操作,则必须指定 value字段。 |
REMOVE | 指定标签在生成时不应包含在指标中。 |
- 现在我们直接应用上面的这个资源对象,然后我们再去访问下 productpage 应用,再次验证下指标数据中是否包含我们移除的
destination_canonical_service标签。
istioctl dashboard prometheus --address 0.0.0.0看下当前指标:(是含有这个destination_canonical_service 标签的)
部署资源,再次验证:
[root@master1 istio]#kubectl apply -f remove-tags.yaml
telemetry.telemetry.istio.io/remove-tags created
[root@master1 istio]#kubectl get telemetries.telemetry.istio.io -nistio-system
NAME          AGE
remove-tags   21s

#重新去访问一次
istioctl dashboard prometheus --address 0.0.0.0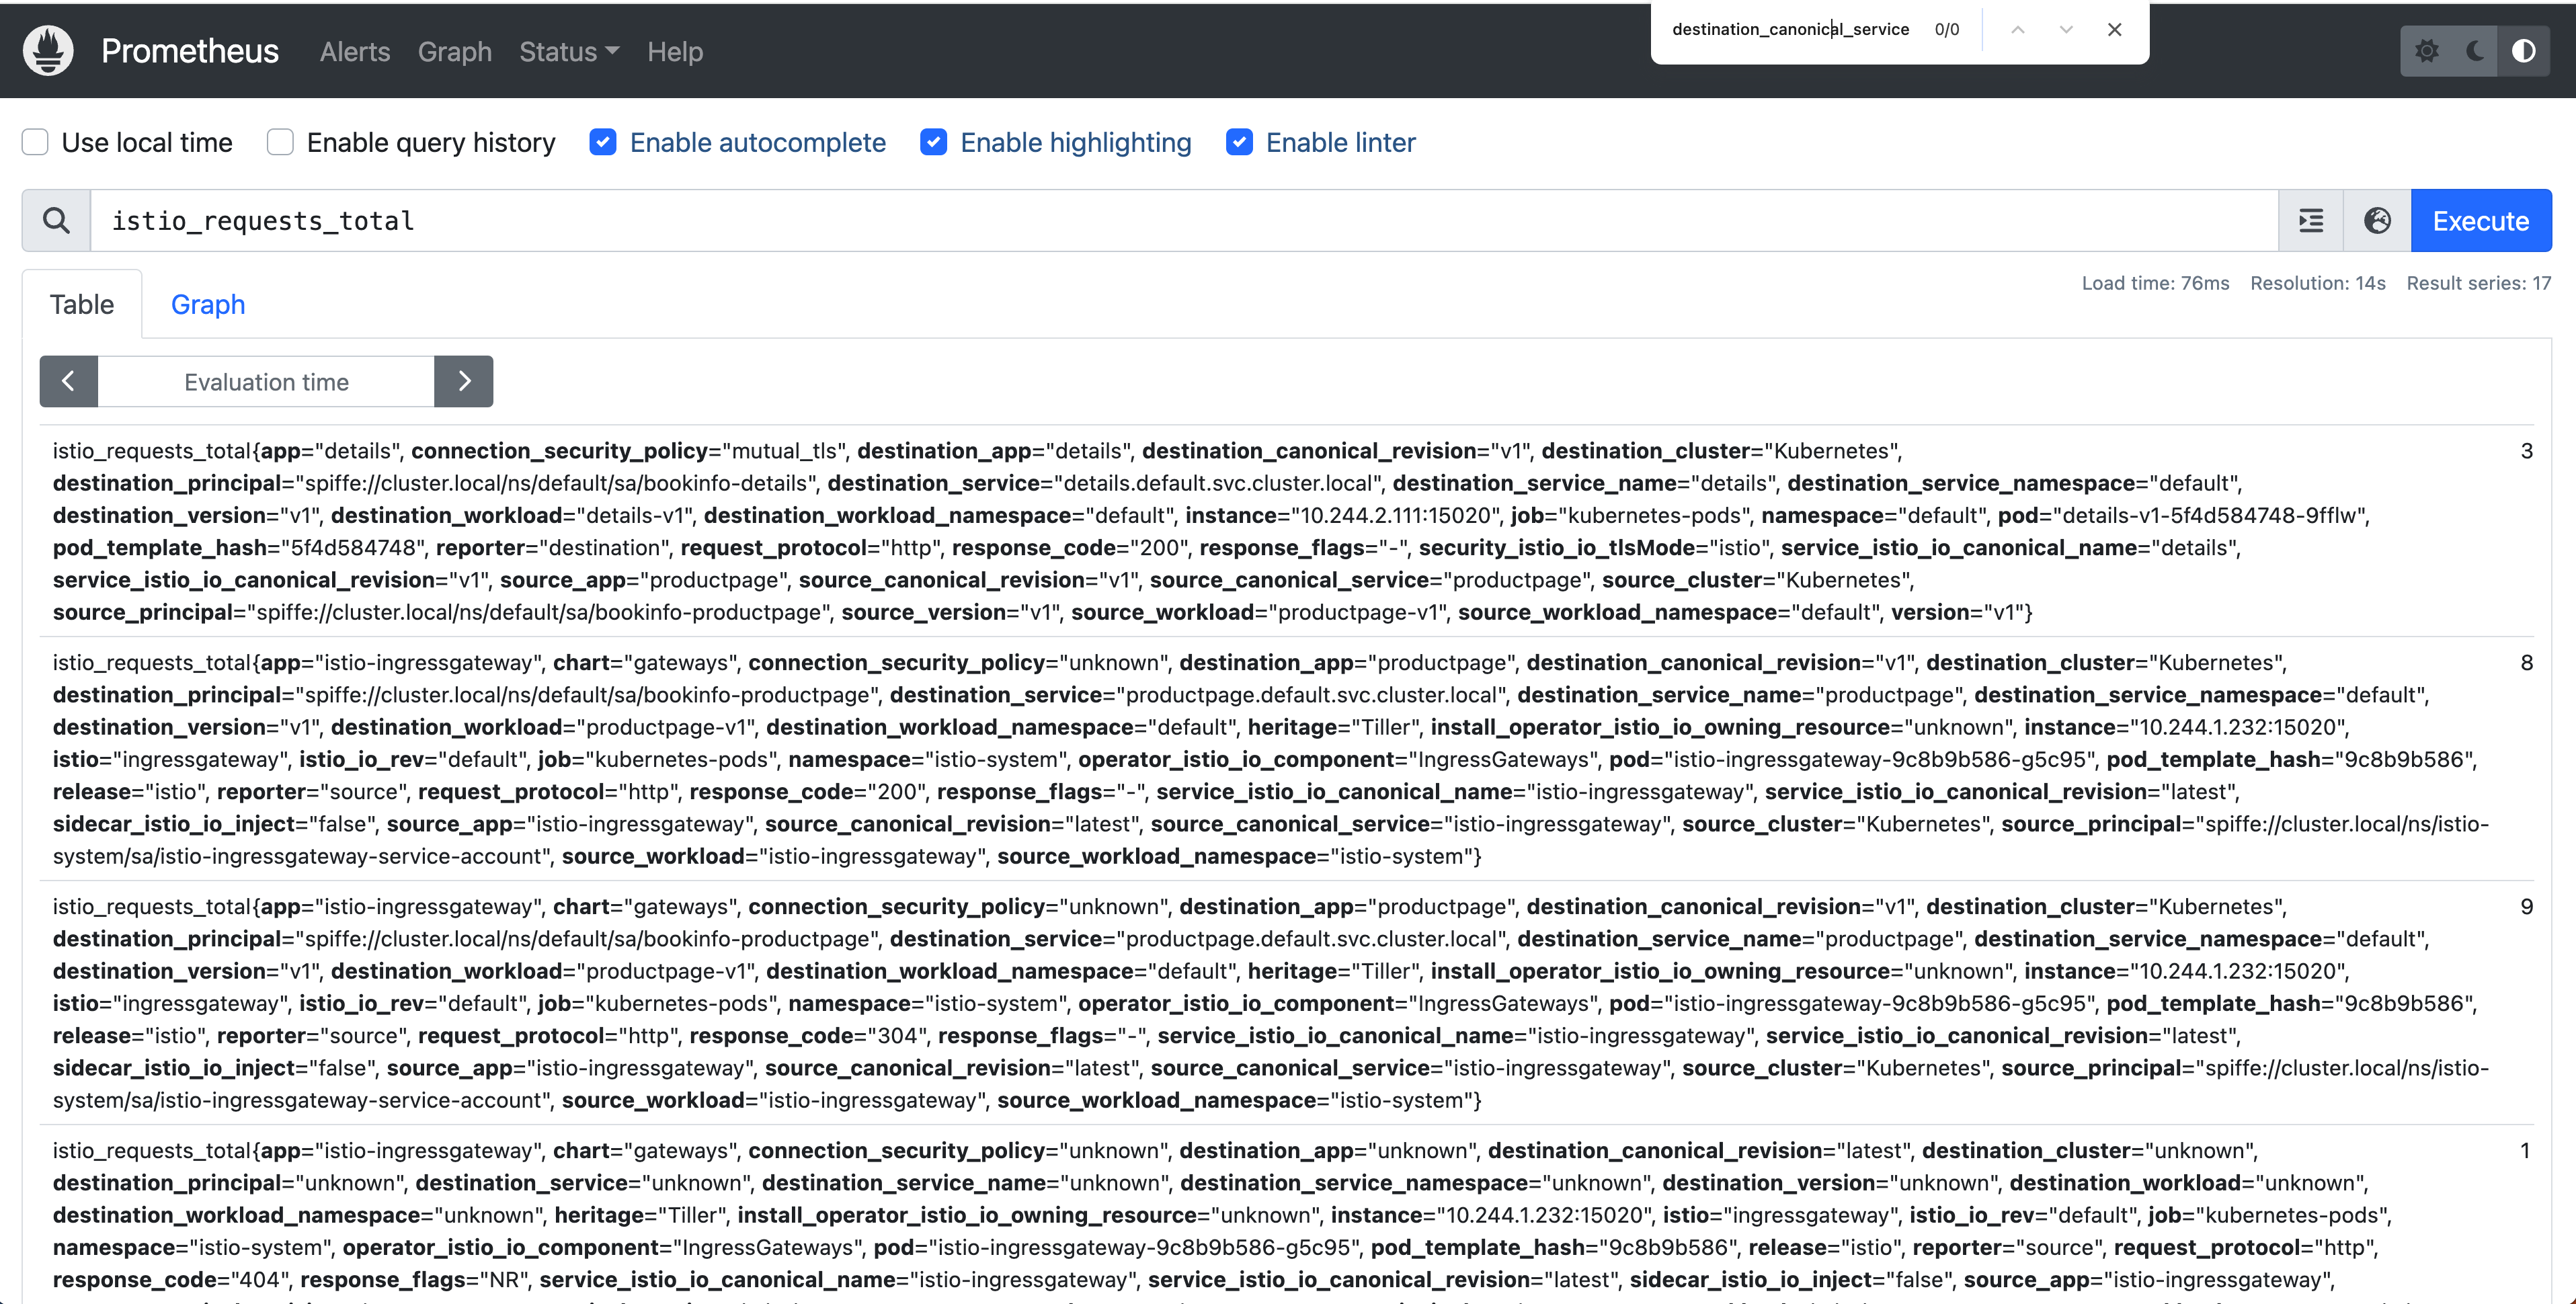
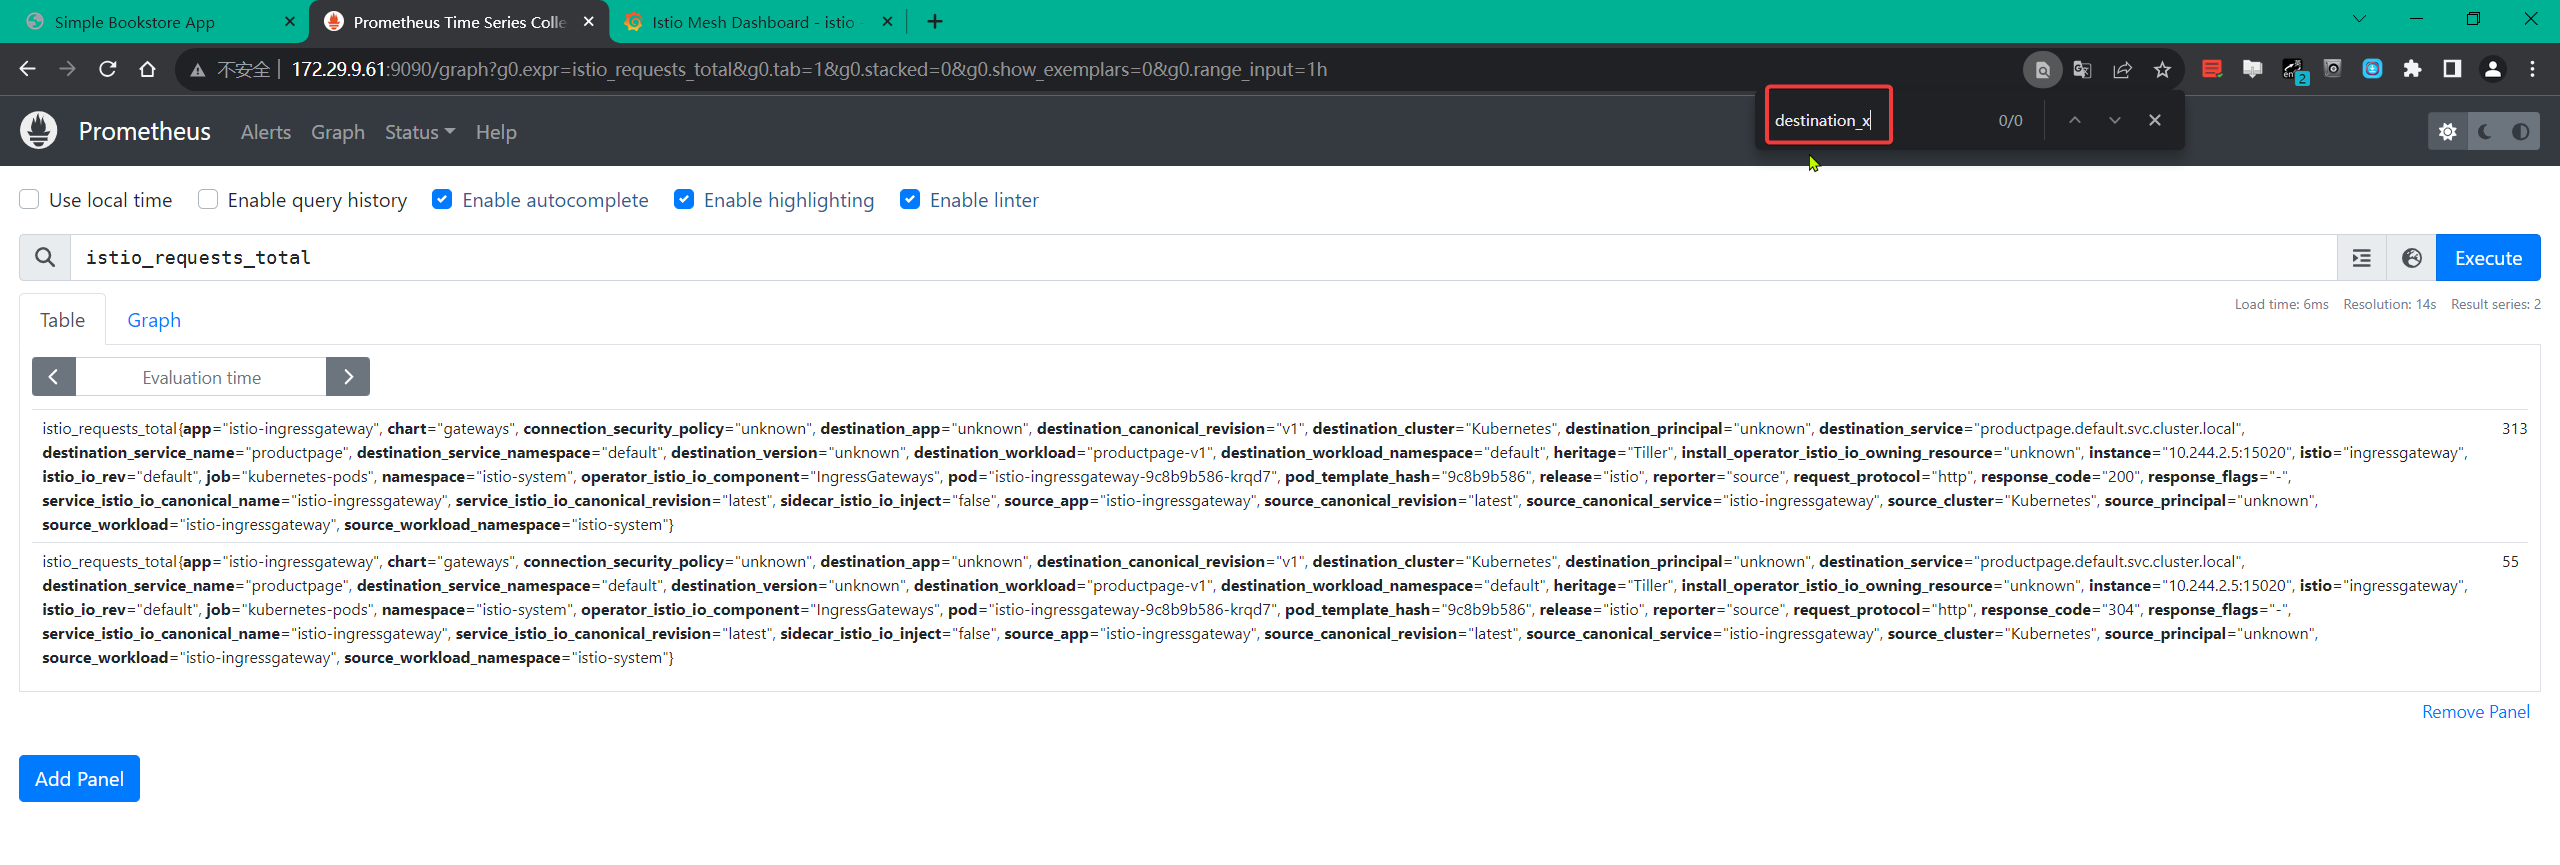
从上面的结果可以看到,我们已经成功删除了 destination_canonical_service 标签,这样就可以减少指标数据的基数了,可以用同样的方法再去删除一些不需要的标签。
另外需要注意在 Telemetry 对象中我们还可以通过
selector字段来配置哪些工作负载应用这个遥测策略,如果未设置,遥测策略将应用于与遥测策略相同的命名空间中的所有工作负载,当然如果是在istio-system命名空间中则会应用于所有命名空间中的工作负载。
测试结束。😘
2.添加指标
🚩 实战:自定义指标-删除标签-2023.12.4
实验环境:
k8s v1.27.6(containerd://1.6.20)(cni:flannel:v0.22.2)
istio v1.19.3(--set profile=demo)实验软件:
链接:https://pan.baidu.com/s/1pMnJxgL63oTlGFlhrfnXsA?pwd=7yqb 提取码:7yqb 2023.11.5-实战:BookInfo 示例应用-2023.11.5(测试成功)
- 上面我们已经介绍了如何删除指标中的标签,那么我们也可以通过 Telemetry API 来添加指标中的标签,如下所示:
#add-tags.yaml
apiVersion: telemetry.istio.io/v1alpha1
kind: Telemetry
metadata:
  name: add-tags
spec:
  metrics:
    - overrides:
        - match:
            metric: REQUEST_COUNT
            mode: CLIENT
          tagOverrides:
            destination_x:
              operation: UPSERT
              value: "upstream_peer.labels['app'].value" # 必须加上双引号
        - match:
            metric: REQUEST_COUNT
          tagOverrides:
            destination_port:
              value: "string(destination.port)"
            request_host:
              value: "request.host"
      providers:
- name: prometheus在上面的这个资源对象中我们在 tagOverrides 中首先添加了如下的配置:
destination_x:
  operation: UPSERT
value: "upstream_peer.labels['app'].value"表示我们要添加一个名为 destination_x 的标签,然后通过 value 字段指定标签的值为 upstream_peer.labels['app'].value,这个值是一个 CEL 表达式(common expression)(必须在 JSON 中用双引号引用字符串)。Istio 暴露了所有标准的 Envoy 属性,对于出站请求,对等方元数据作为上游对等方(upstream_peer)的属性可用;对于入站请求,对等方元数据作为下游对等方(downstream_peer)的属性可用,包含以下字段:
| 属性 | 类型 | 值 |
|---|---|---|
name | string | Pod 名 |
namespace | string | Pod 所在命名空间 |
labels | map | 工作负载标签 |
owner | string | 工作负载 owner |
workload_name | string | 工作负载名称 |
platform_metadata | map | 平台元数据 |
istio_version | string | 代理的版本标识 |
mesh_id | string | 网格唯一 ID |
app_containers | list<string> | 应用容器的名称列表 |
cluster_id | string | 工作负载所属的集群标识 |
例如,用于出站配置中的对等应用标签的表达式是 upstream_peer.labels['app'].value,所以上面我们最终添加的 destination_x 这个标签的值为上游对等方的 app 标签的值。
另外添加的两个标签 destination_port 和 request_host 的值分别为 string(destination.port) 和 request.host,这两个值就来源于暴露的 Envoy 属性。
另外这个资源对象我们指定的是 default 命名空间,则只会对 default 命名空间中的工作负载应用这个遥测策略。
- 同样应用这个资源对象后,再次访问 productpage 应用产生指标,现在我们可以看到指标中已经包含了我们添加的标签了。
[root@master1 istio]#kubectl apply -f add-tags.yaml
telemetry.telemetry.istio.io/add-tags created
[root@master1 istio]#kubectl get telemetries.telemetry.istio.io
NAME       AGE
add-tags   20s

#istioctl dashboard prometheus --address 0.0.0.0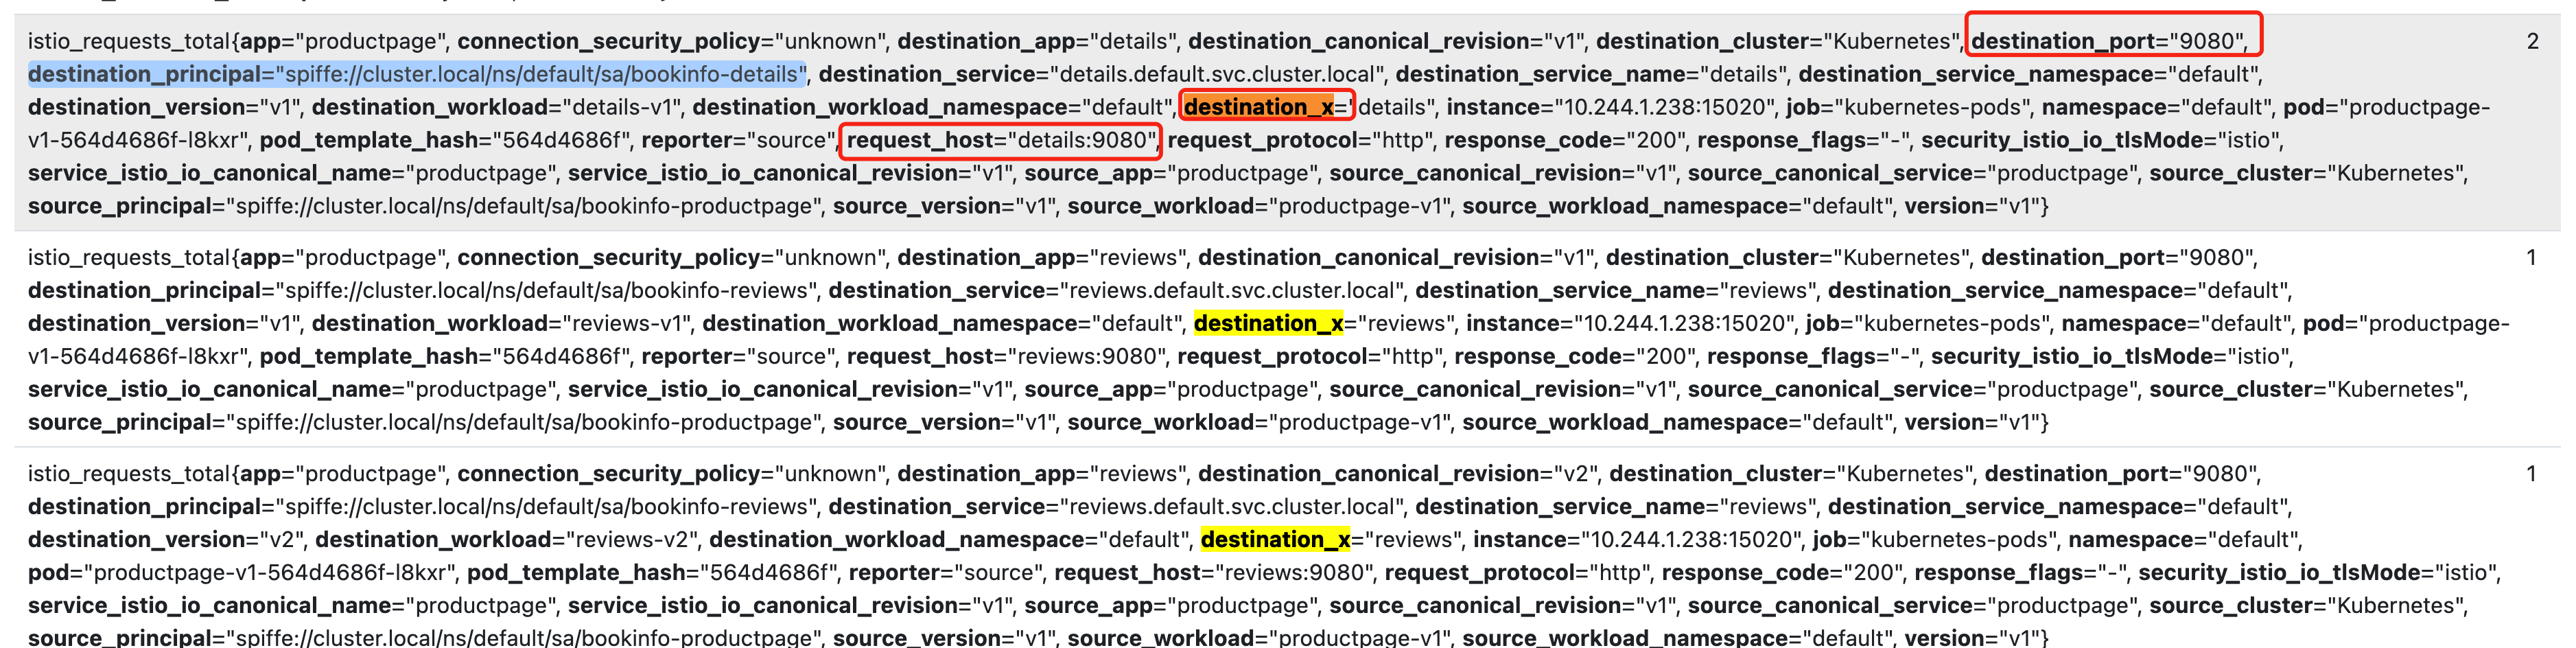
测试结束。😘
- 奇怪:我这里没有现象……(prometheus都已经删除重建过了的…… 先搁置吧。)
3.禁用指标
对于禁用指标则相对更简单了。
比如我们通过以下配置禁用所有指标:
apiVersion: telemetry.istio.io/v1alpha1
kind: Telemetry
metadata:
  name: remove-all-metrics
  namespace: istio-system
spec:
  metrics:
    - providers:
        - name: prometheus
      overrides:
        - disabled: true
          match:
            mode: CLIENT_AND_SERVER
metric: ALL_METRICS通过以下配置禁用 REQUEST_COUNT 指标:
apiVersion: telemetry.istio.io/v1alpha1
kind: Telemetry
metadata:
  name: remove-request-count
  namespace: istio-system
spec:
  metrics:
    - providers:
        - name: prometheus
      overrides:
        - disabled: true
          match:
            mode: CLIENT_AND_SERVER
metric: REQUEST_COUNT通过以下配置禁用客户端的 REQUEST_COUNT 指标:
apiVersion: telemetry.istio.io/v1alpha1
kind: Telemetry
metadata:
  name: remove-client
  namespace: istio-system
spec:
  metrics:
    - providers:
        - name: prometheus
      overrides:
        - disabled: true
          match:
            mode: CLIENT
metric: REQUEST_COUNT通过以下配置禁用服务端的 REQUEST_COUNT 指标:
apiVersion: telemetry.istio.io/v1alpha1
kind: Telemetry
metadata:
  name: remove-server
  namespace: istio-system
spec:
  metrics:
    - providers:
        - name: prometheus
      overrides:
        - disabled: true
          match:
            mode: SERVER
metric: REQUEST_COUNT到这里我们就了解了如何通过 Telemetry API 来自定义指标了,这样我们就可以根据自身的需求来定制了。
2、分布式追踪
分布式追踪可以让用户对跨多个分布式服务网格的请求进行追踪分析,可以通过可视化的方式更加深入地了解请求的延迟,序列化和并行度。Istio 利用 Envoy 的分布式追踪功能提供了开箱即用的追踪集成,Istio 提供了安装各种追踪后端服务的选项,并且通过配置代理来自动发送追踪 Span 到分布式追踪系统服务,比如 Zipkin、Jaeger、Lightstep、Skywalking 等后端服务。
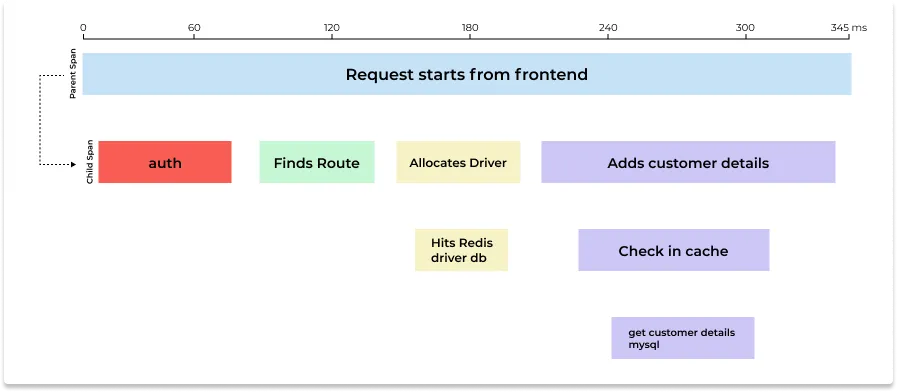
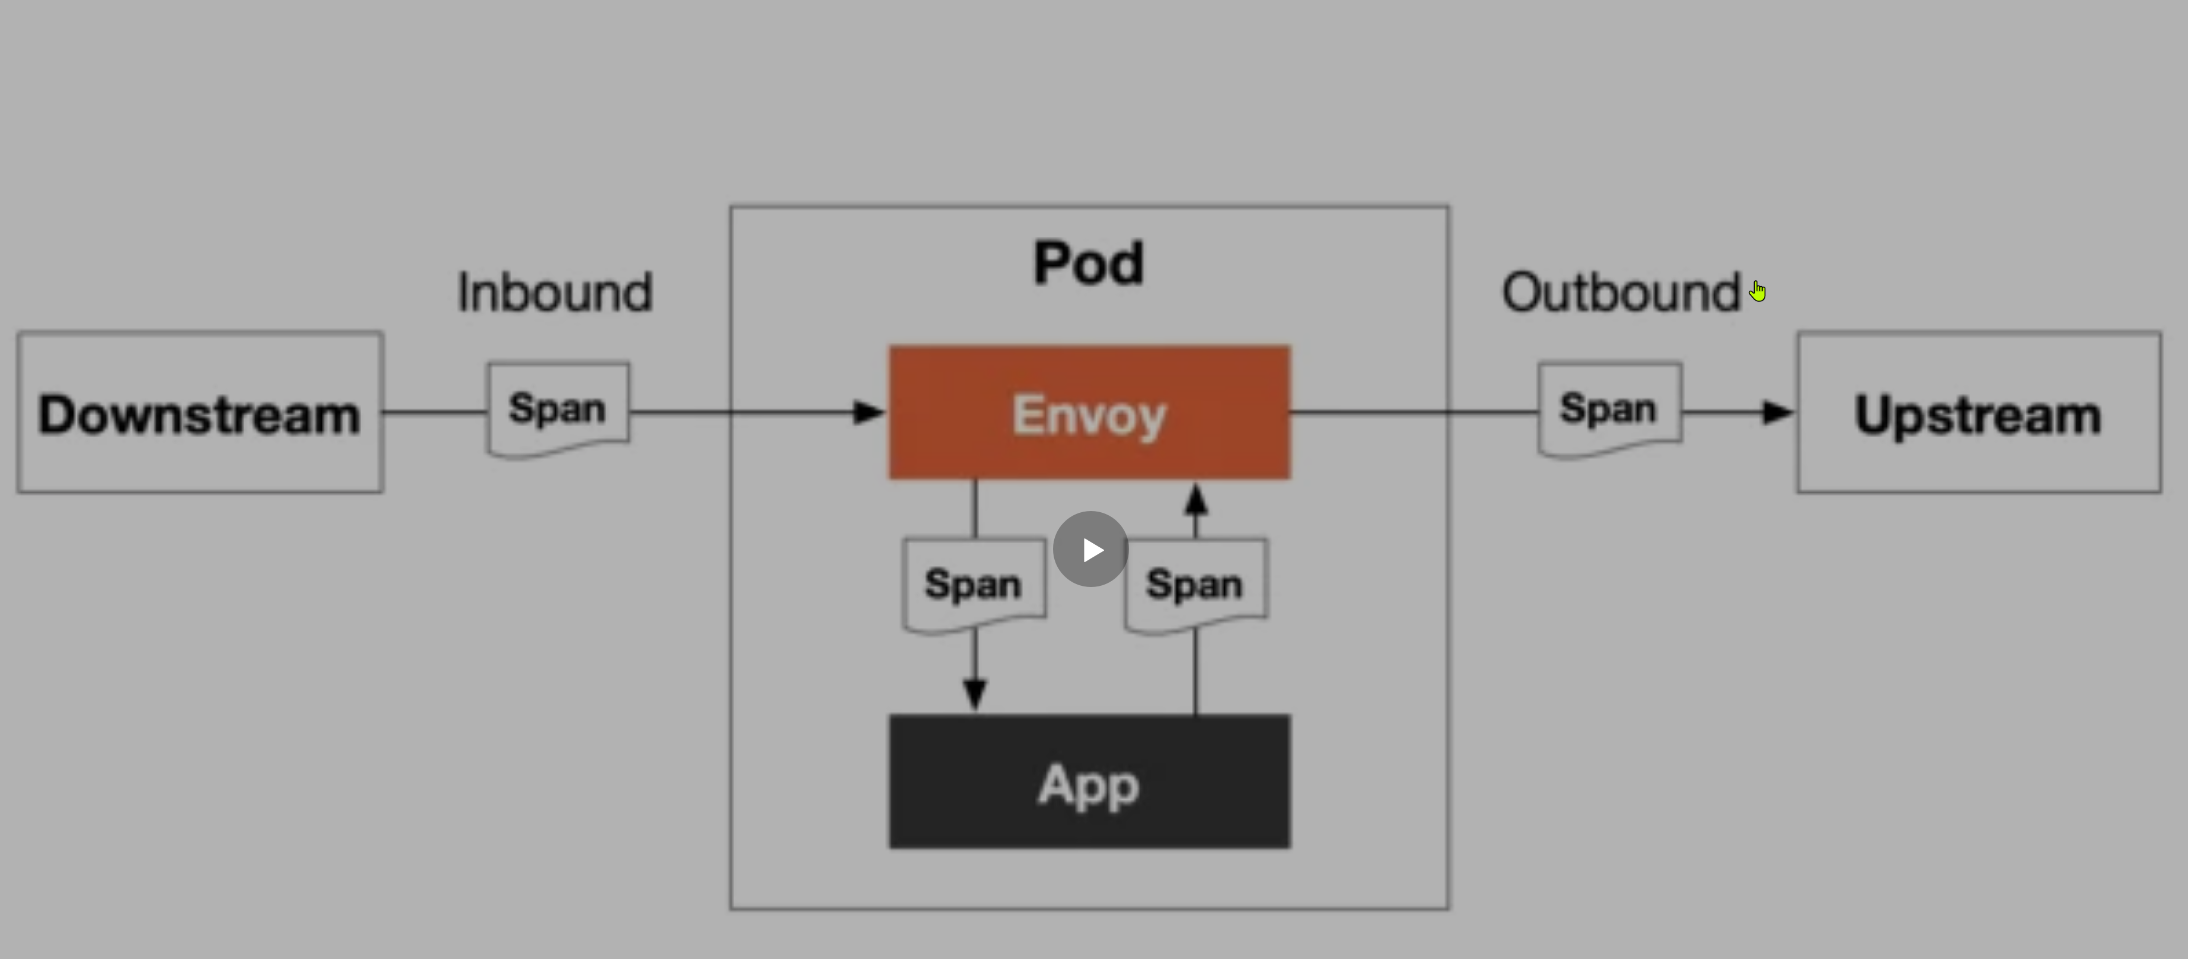
一次完整的链路是由多个 span 组成的,每个 span 代表了一次请求的一部分,每个 span 都有一个唯一的 ID,这个 ID 用来标识这个 span,同时还有一个父 span 的 ID,用来标识这个 span 的父 span,这样就可以将多个 span 组成一个链路了。将不同的 span 关联到一起的方式是通过将父 span 的 ID 传递给子 span,这样就可以将多个 span 关联起来了,也就是上下文传递。
上下文传递
尽管 Istio 代理能够自动发送 Span,但需要一些附加信息才能将这些 Span 加到同一个调用链,所以当代理发送 Span 信息的时候,应用程序需要附加适当的 HTTP 请求头信息,这样才能够把多个 Span 加到同一个调用链。
要做到这一点,每个应用程序必须从每个传入的请求中收集请求头(Header),并将这些请求头转发到传入请求所触发的所有传出请求。 具体选择转发哪些请求头取决于所配置的跟踪后端。
虽然 Istio 代理能够自动发送 span 信息,但它们需要一些提示来将整个跟踪关联起来。应用程序需要传播适当的 HTTP 头,以便当代理发送 span 信息时,span 能够正确地关联到单个跟踪中。为了实现这一点,应用程序需要从传入的请求中收集和传播头信息到所有的外发请求。要传播的头信息的选择取决于所使用的跟踪配置。
首先所有应用程序必须转发以下请求头:
x-request-id:这是 Envoy 专用的请求头,用于对日志和追踪进行一致的采样。
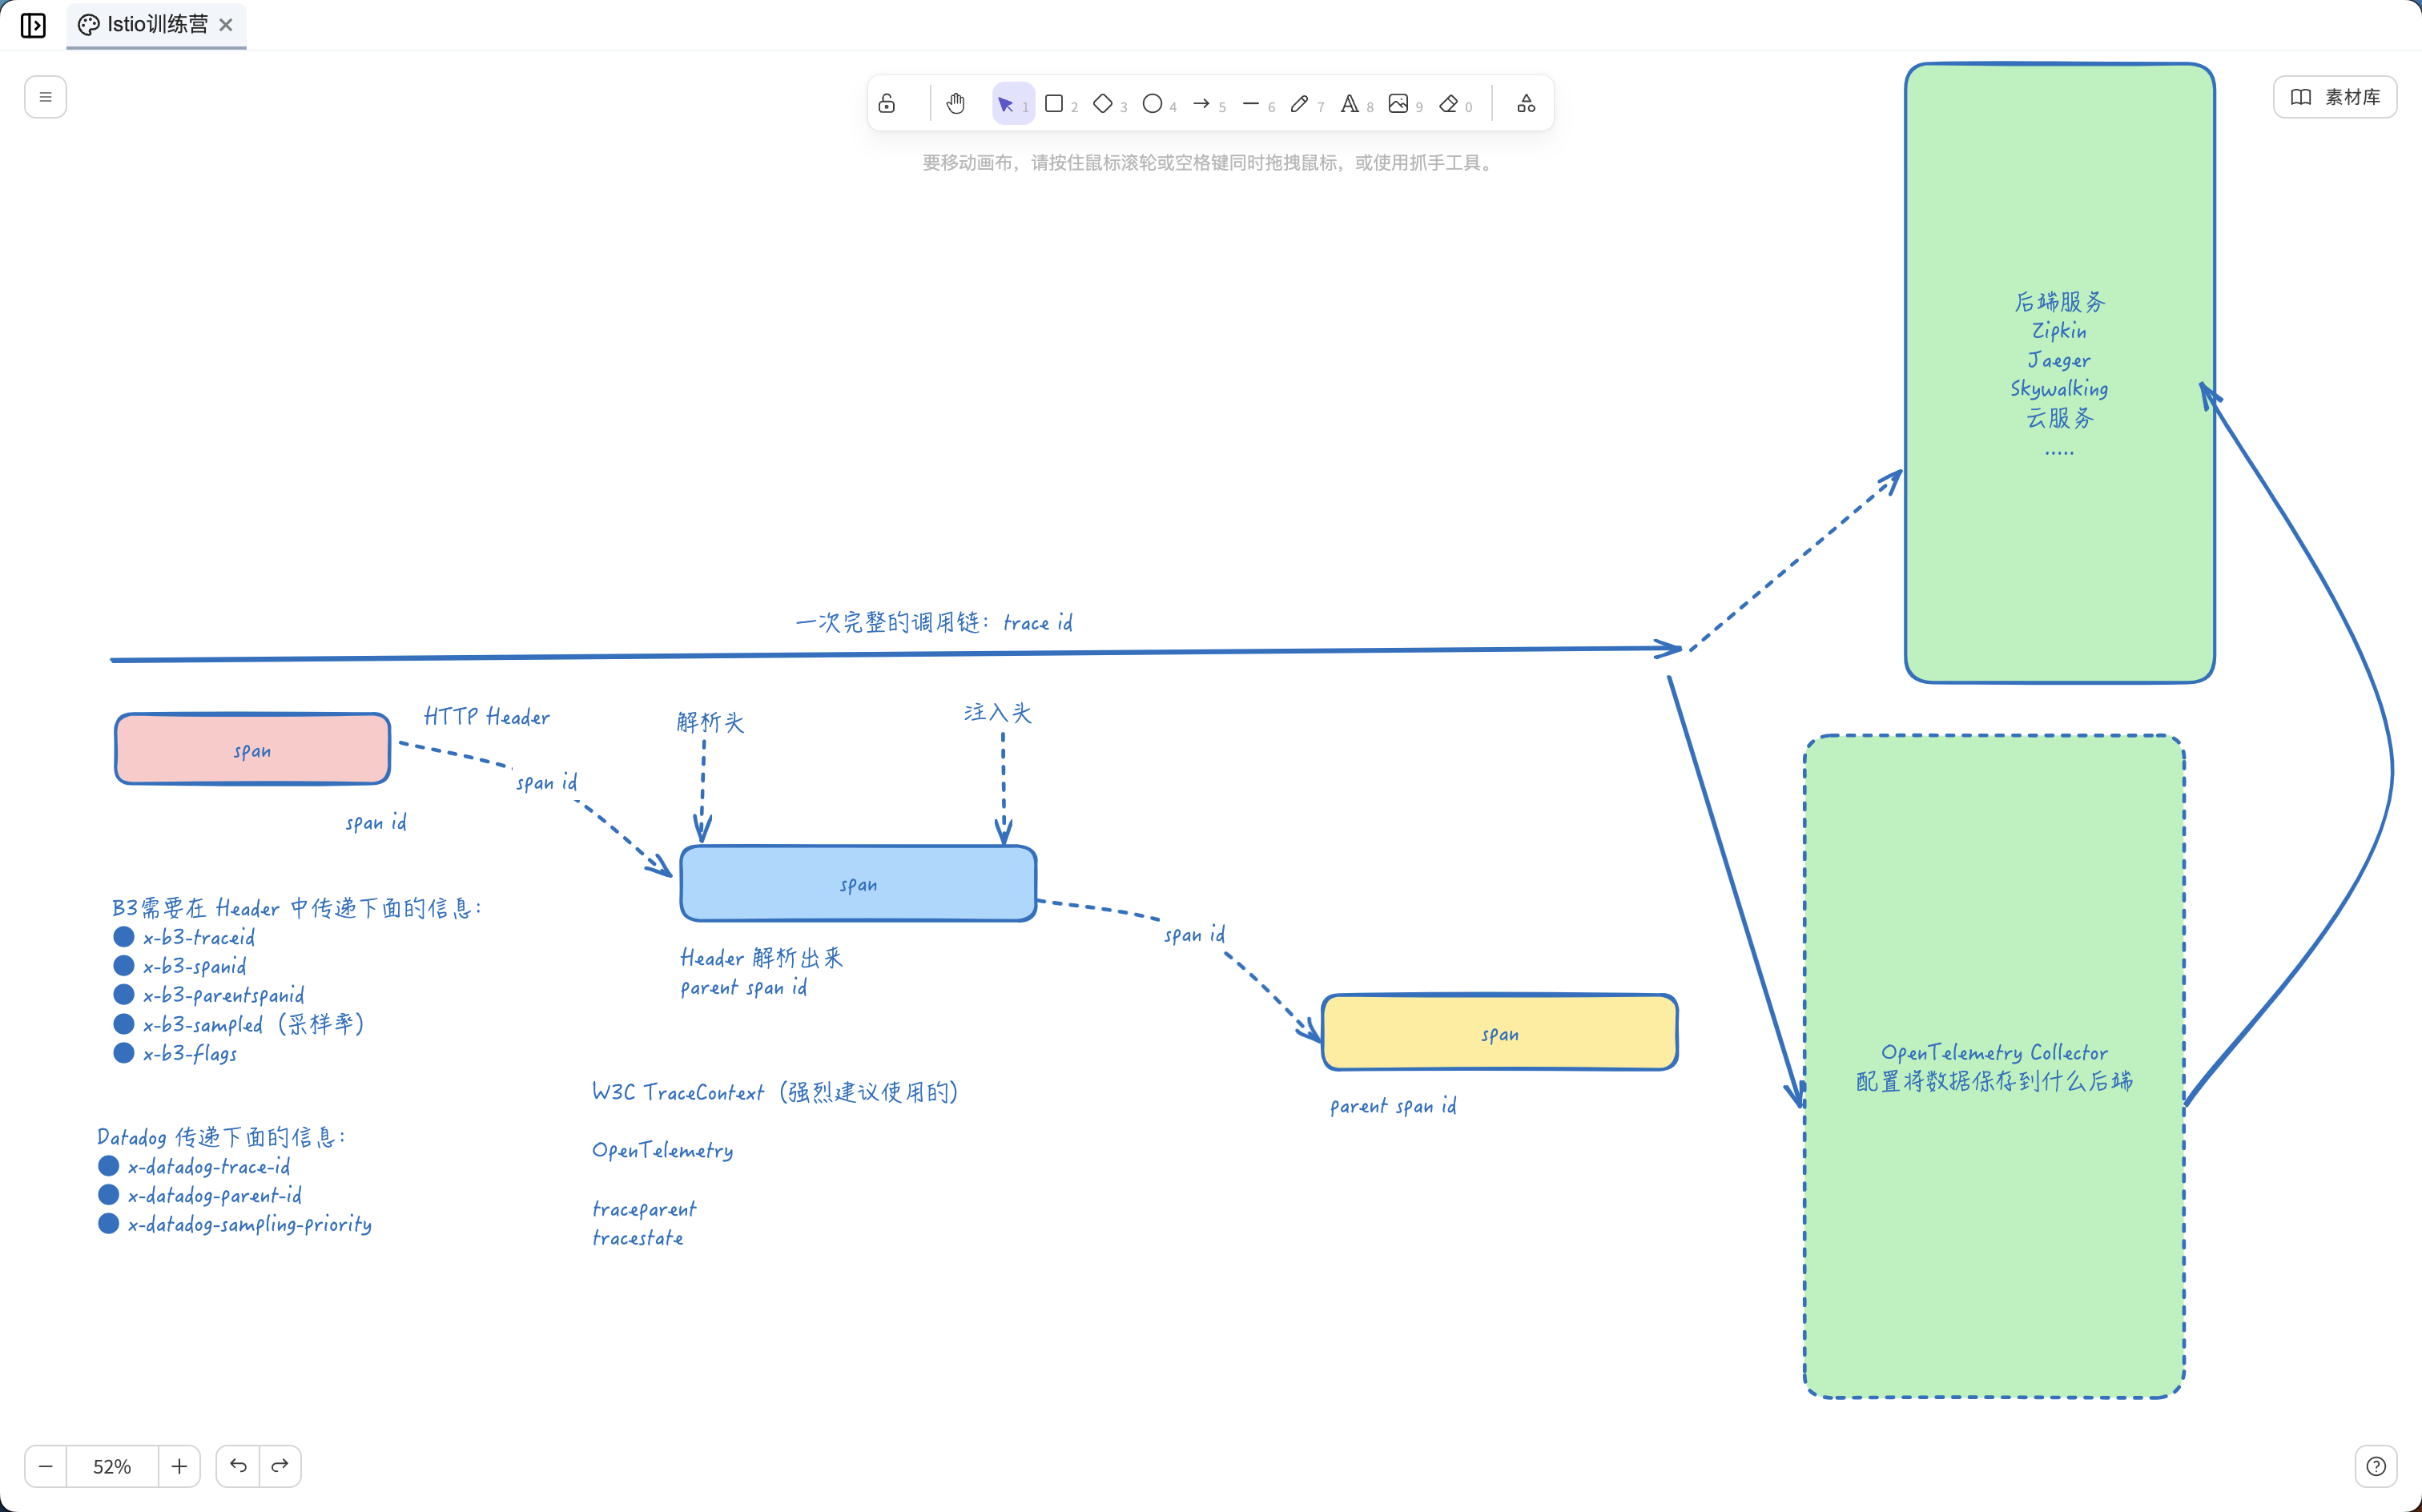
对于 Zipkin、Jaeger、Stackdriver 和 OpenCensus Agent,应转发 B3 请求头格式:
x-b3-traceidx-b3-spanidx-b3-parentspanidx-b3-sampledx-b3-flags
这些是 Zipkin、Jaeger、OpenCensus 和许多其他工具支持的请求头。
B3 是一个跟踪上下文传播的格式,它起源于 Zipkin 项目,但后来被其他许多分布式跟踪工具所采用。B3 的名字来源于 BigBrotherBird,它的主要目的是为了在服务之间传播跟踪上下文。它是由一组特定的 HTTP 头部组成的,可以传递跟踪信息,如 trace ID、span ID、采样决策等。
对于 Datadog,应转发以下请求头,对于许多语言和框架而言,这些转发由 Datadog 客户端库自动处理。
x-datadog-trace-idx-datadog-parent-idx-datadog-sampling-priority
对于 Lightstep,应转发 OpenTracing span 上下文请求头:
x-ot-span-context
对于 Stackdriver 和 OpenCensus Agent,可以使用以下任一请求头来替代 B3 多请求头格式。
grpc-trace-bin:标准的 gRPC 追踪头。traceparent:追踪所用的W3C追踪上下文标准,受所有 OpenCensus、OpenTelemetry 和 Jaeger 客户端库所支持。x-cloud-trace-context:由 Google Cloud 产品 API 使用。
W3C Trace Context 规范为追踪上下文传播数据的交换定义了一种普遍认同的格式 - 称为追踪上下文。Trace Context 是一个在分布式追踪中用于跨服务和跨进程传递 trace 数据的标准。它定义了如何在 HTTP headers 中编码 trace 数据,以便在不同的服务间传递这些数据。具体来说,Trace Context 包含两个部分:traceparent 和 tracestate。
traceparent以便携、固定长度的格式描述了传入请求在其追踪链路中的位置。它的设计重点是快速解析,每个跟踪工具都必须正确设置traceparent,即使它仅依赖于tracestate中的供应商特定信息。tracestate通过一组name/value键值对表示来扩展带有供应商特定数据的traceparent。将信息存储在tracestate中是可选的。
使用 W3C 跟踪上下文上下文传播接收 HTTP 请求可能如下所示:
GET /my-service HTTP/1.1
Host: myhost.com
traceparent: 00–0af7651916cd43dd8448eb211c80319c-b7ad6b7169203331–01
tracestate: abc=00f067aa0ba902b7,xyz=99f067aa0ba902b7traceparent 字段
Traceparent HTTP Header 字段标识跟踪系统中的传入请求,这是一个必要的部分,它由 4 个部分组成,所有字段都使用 16 进制编码:
version:系统适配的追踪上下文版本,当前版本是00。trace-id:一个全局唯一的 ID,用于标识整个 trace,它是一个 32 个字符的十六进制字符串。parent-id:一个服务内唯一的 ID,用于标识调用链中的当前操作(通常是一个函数或者请求处理器)。它是一个 16 个字符的十六进制字符串。trace-flags:用于控制 trace 的行为,例如是否需要被采样等。
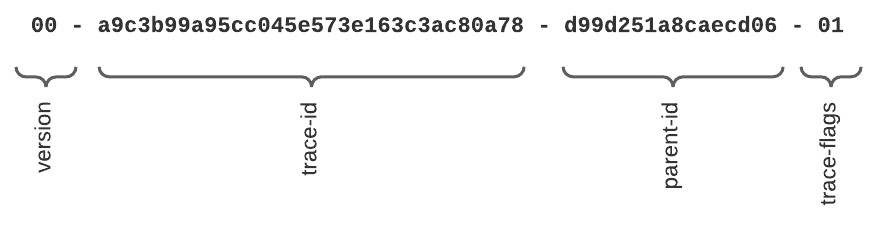
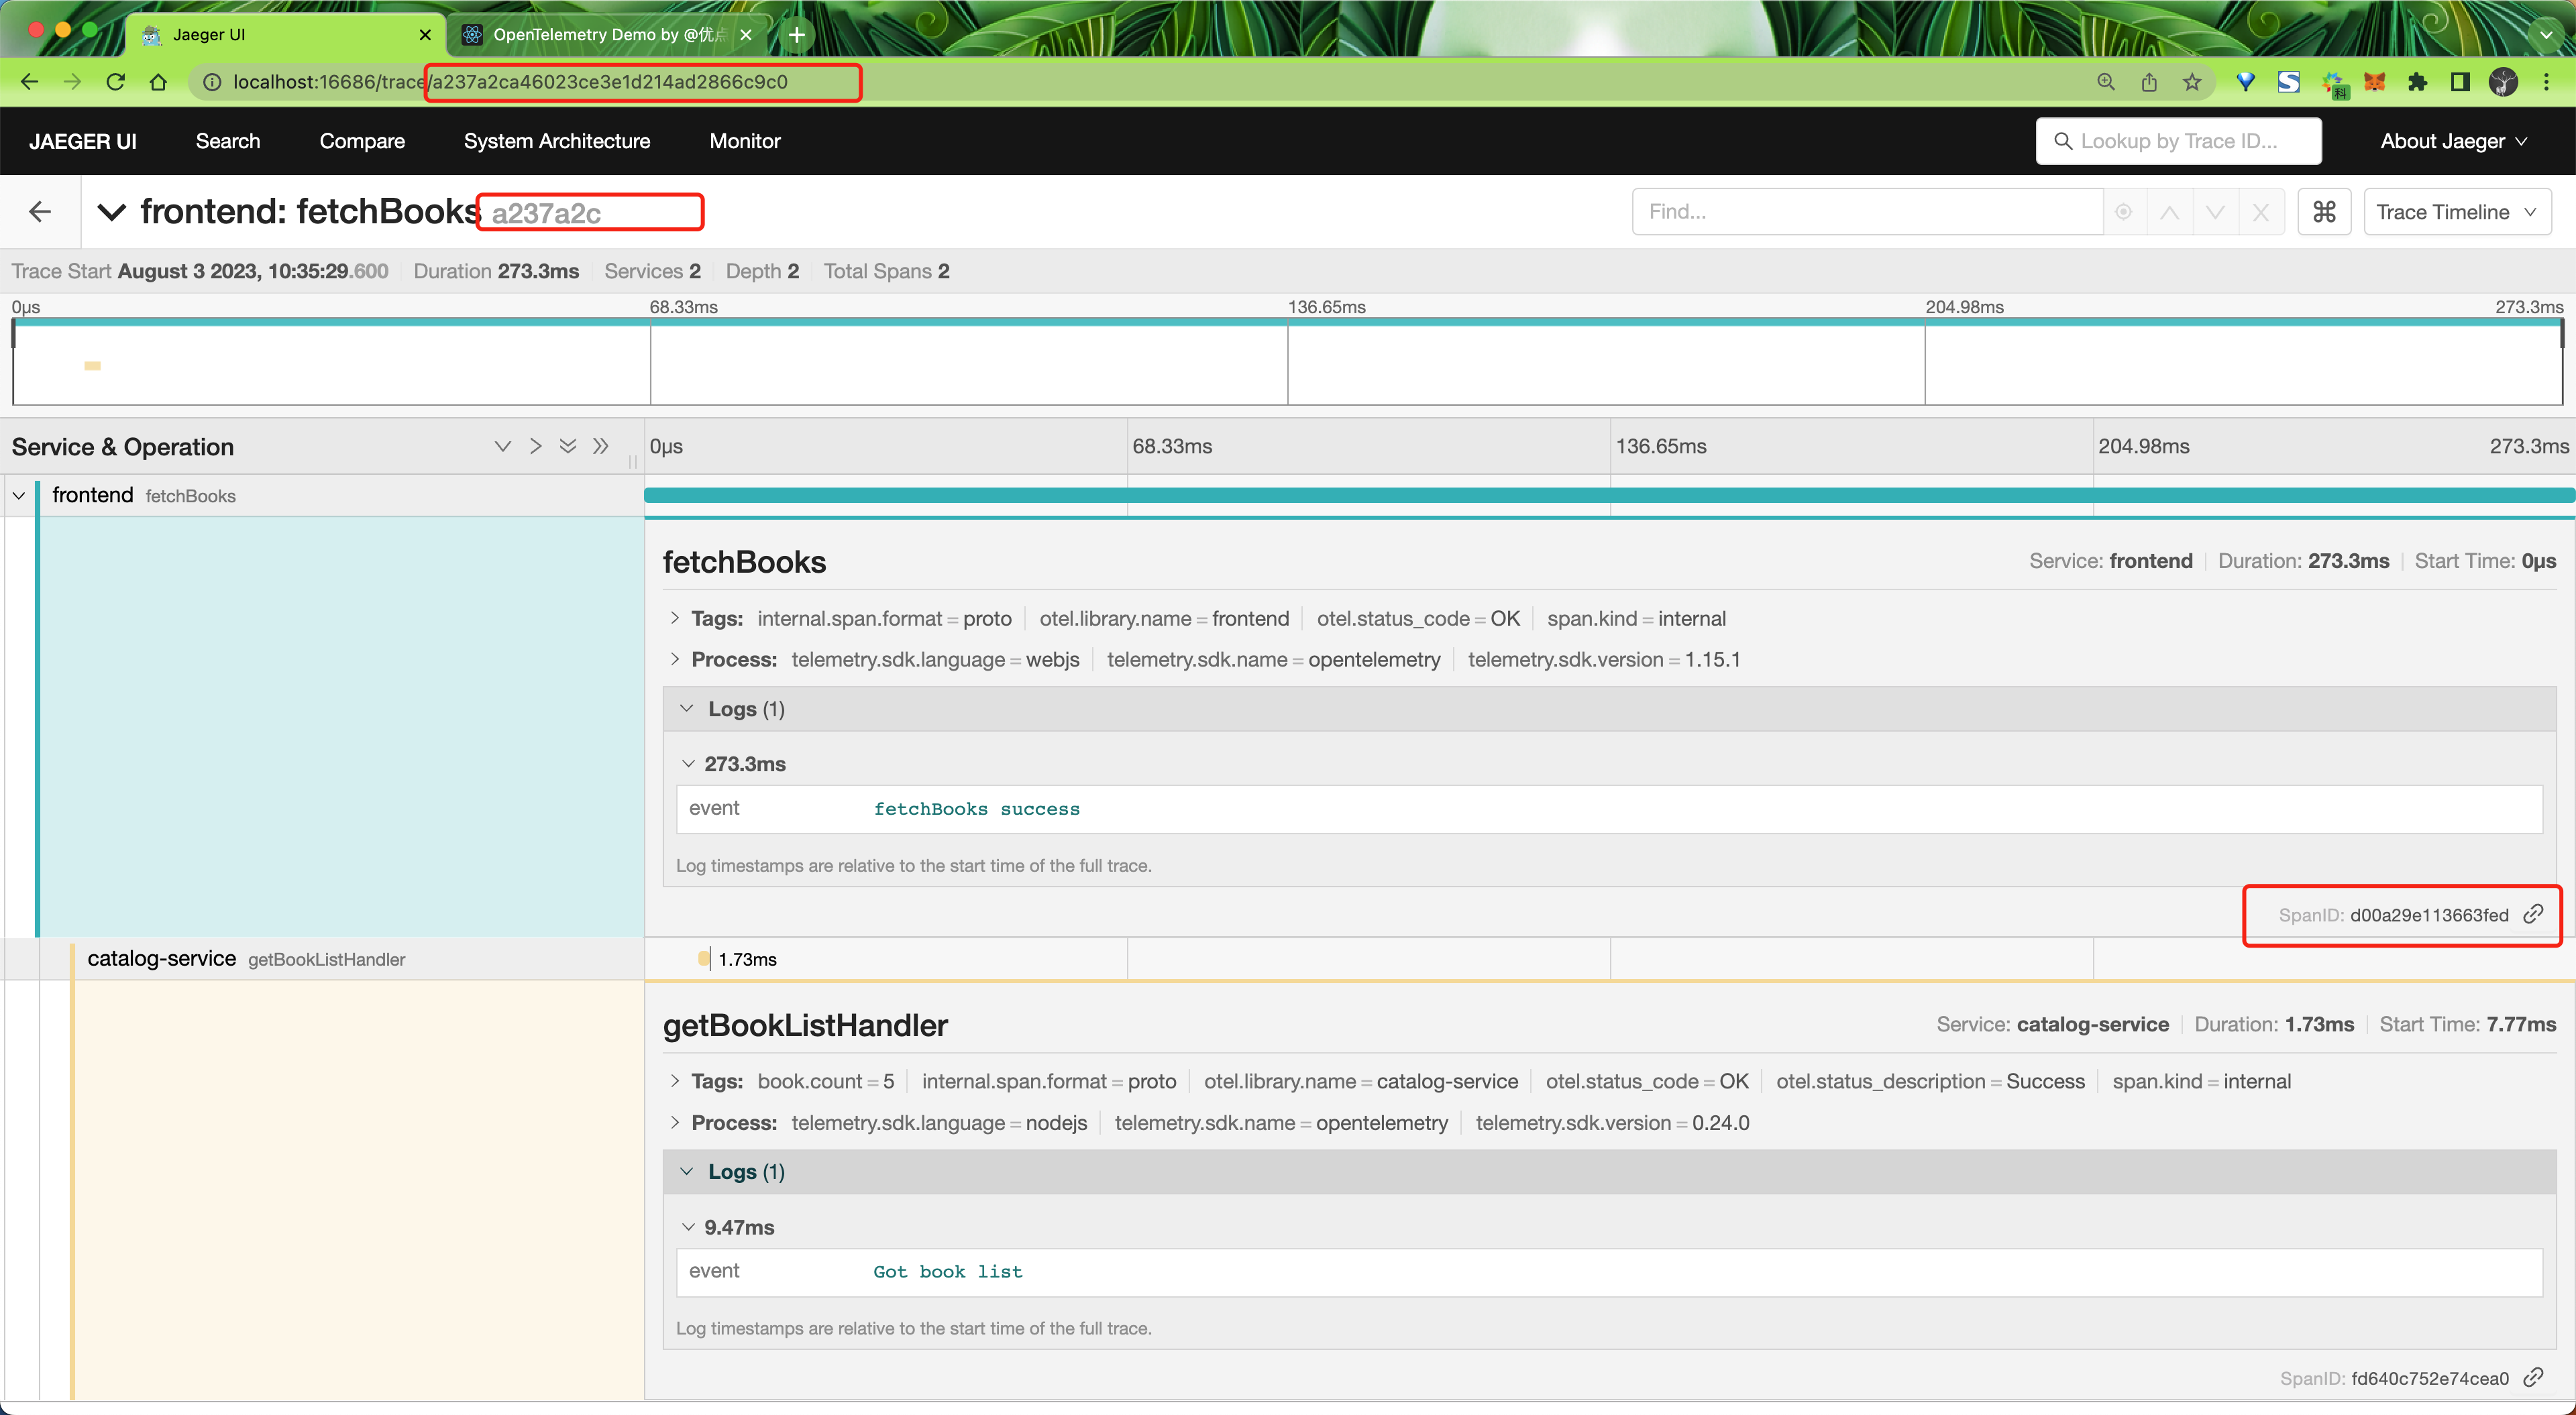
比如我们有一个前端应用中的一个接口中添加了 Trace Context,它的 traceparent 就是这样的:
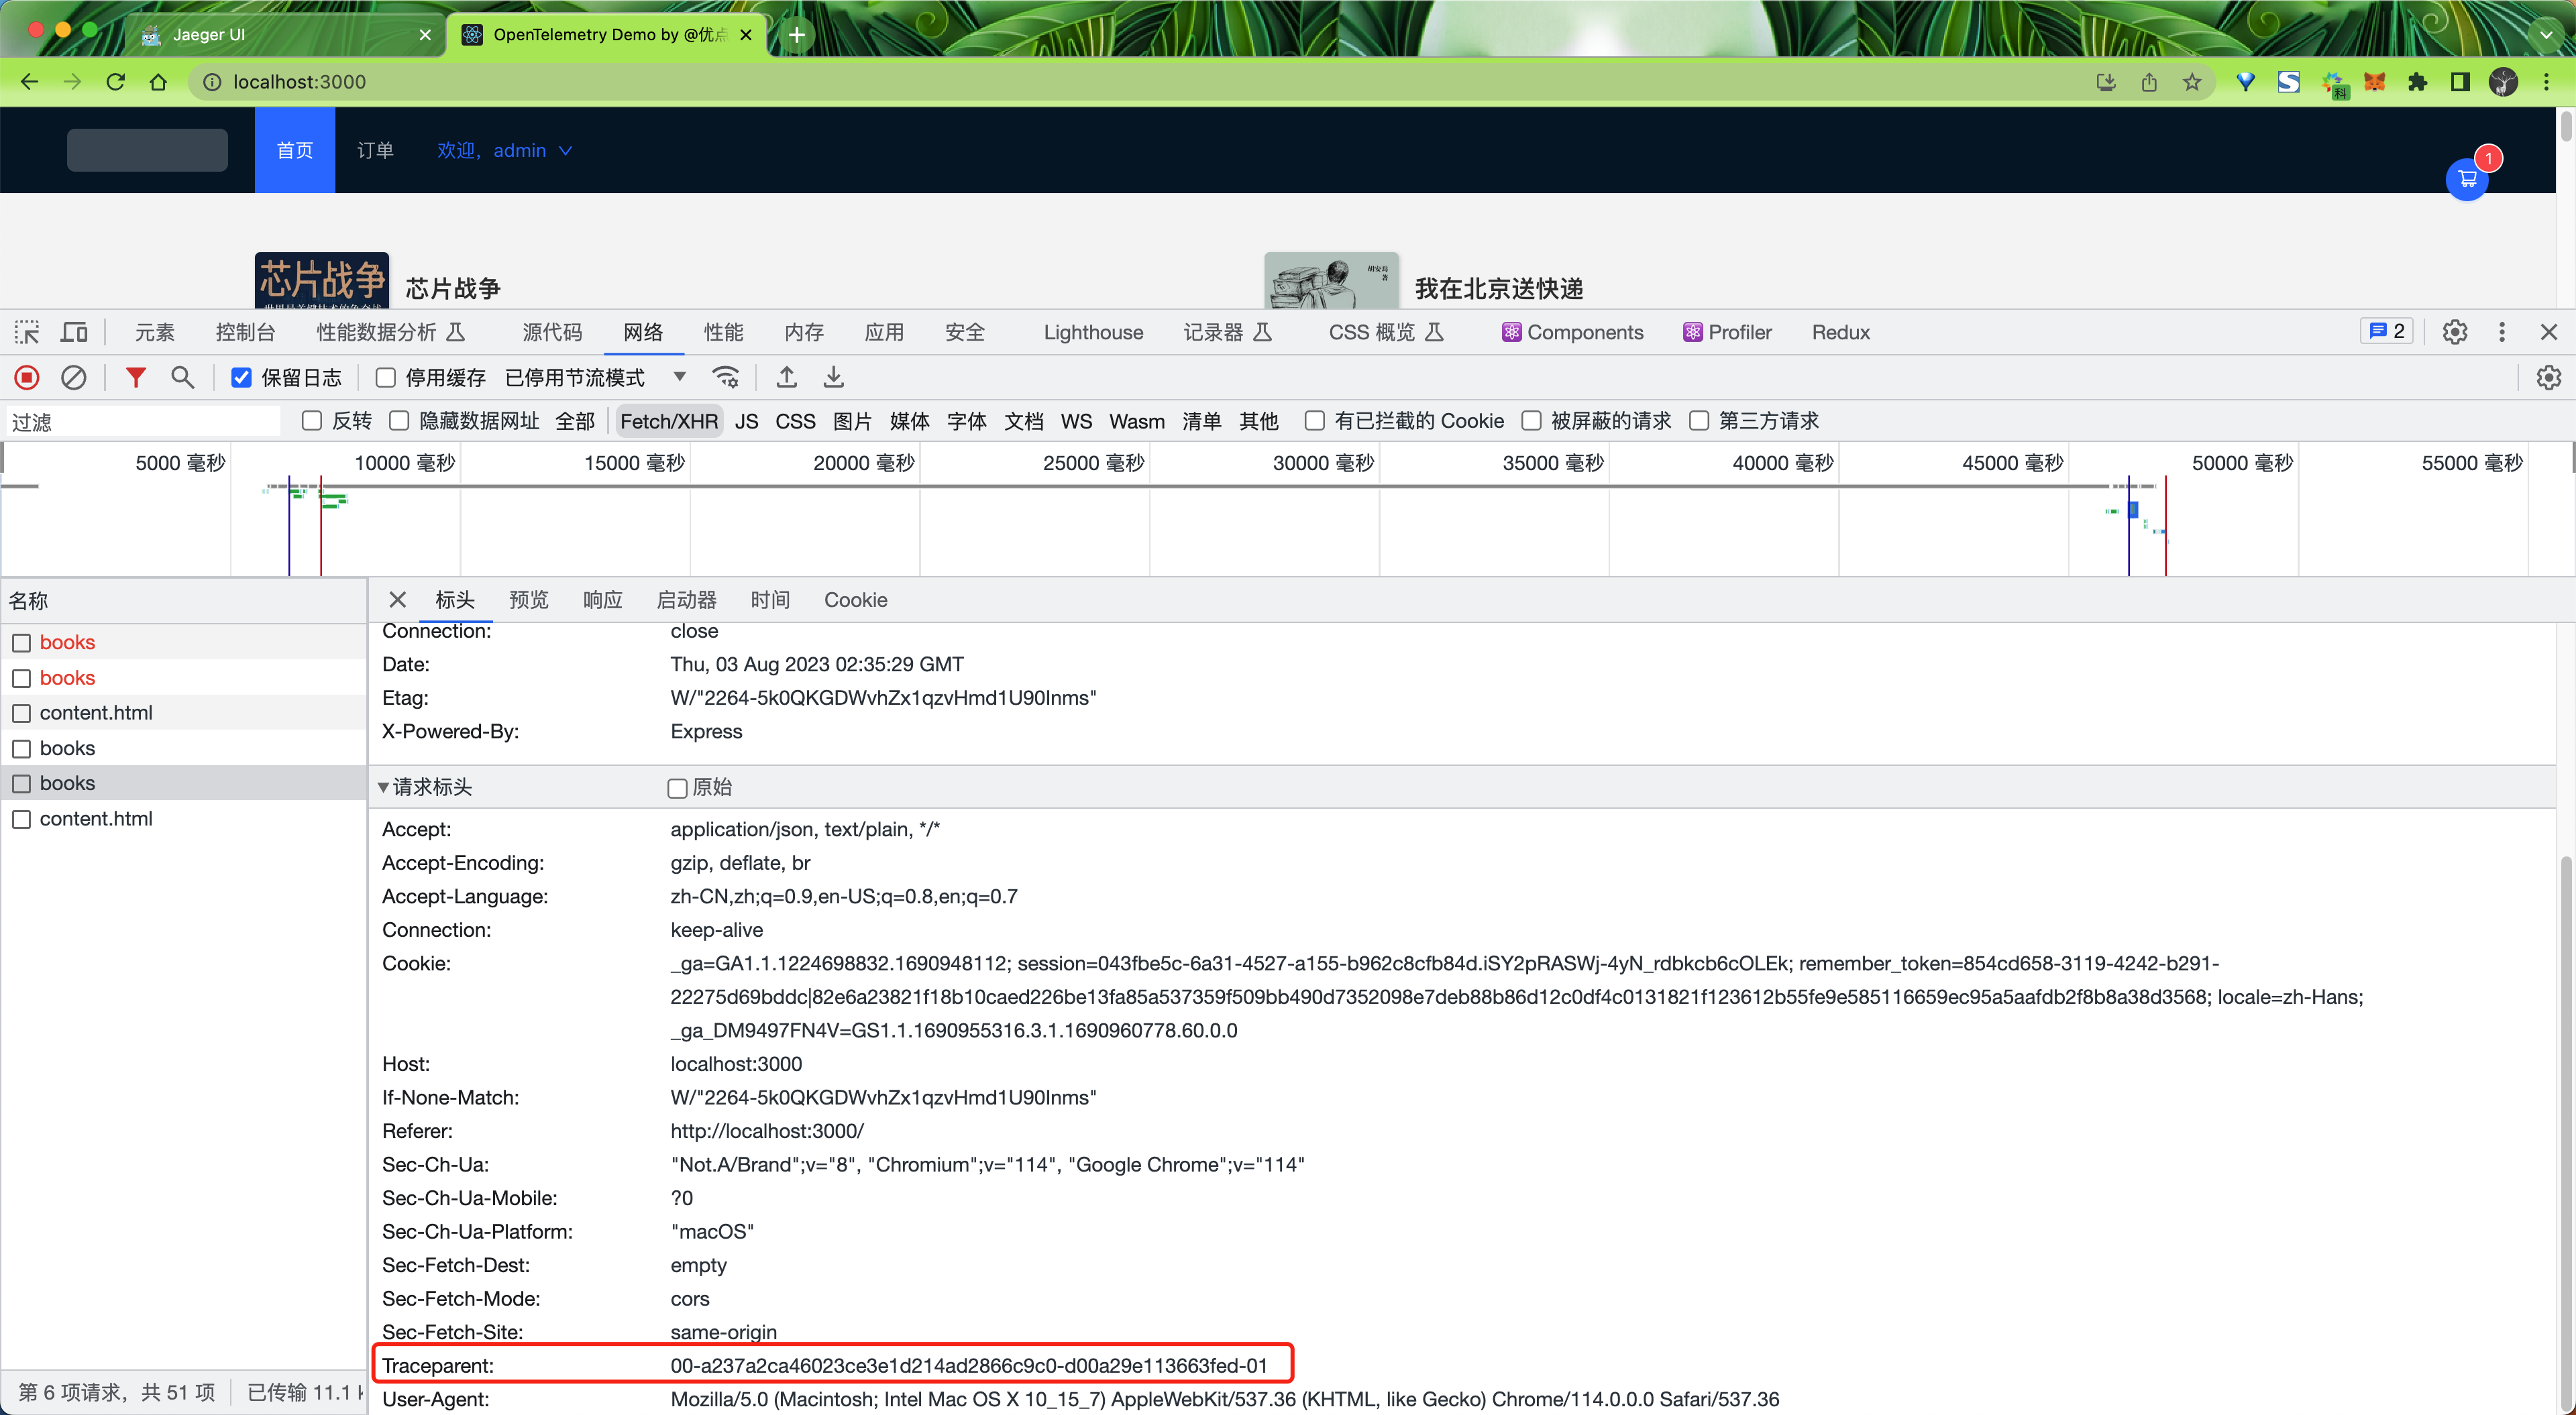
比如我们这里一次 HTTP 请求中通过 Header 传递的 Traceparent 值为 00-a237a2ca46023ce3e1d214ad2866c9c0-d00a29e113663fed-01,对应到 Jaeger UI 中 trace id 为 a237a2ca46023ce3e1d214ad2866c9c0,parent id(也就是父级的 span id)为 d00a29e113663fed,trace flags 为 01。
tracestate 字段
tracestate 这是一个可选的部分,用于跨多个服务传递额外的 trace 信息。它是一个键值对列表,列表中的每一项都由一个服务添加。服务可以在 tracestate 中添加一些自定义的数据,例如服务的版本、部署环境等。
Jaeger
接下来我们来看下如何在 Istio 中集成 Jaeger,Jaeger 是一个开源的分布式追踪系统,它由 Uber 开源,用于监视和故障排除复杂的分布式系统。同样我们这里还是以 Bookinfo 为例进行说明。
- 首先要安装 Jaeger,我们这里只是演示,可以直接使用下面的方式进行安装:
$ kubectl apply -f samples/addons/jaeger.yaml
$ kubectl get pods -n istio-system -l app=jaeger
NAME                     READY   STATUS    RESTARTS         AGE
jaeger-db6bdfcb4-qpmmv   1/1     Running   20 (5h40m ago)   29d
$ kubectl get svc -n istio-system
NAME                   TYPE           CLUSTER-IP       EXTERNAL-IP   PORT(S)                                                                      AGE
jaeger-collector       ClusterIP      10.107.60.208    <none>        14268/TCP,14250/TCP,9411/TCP,4317/TCP,4318/TCP                               29d
tracing                ClusterIP      10.98.235.44     <none>        80/TCP,16685/TCP                                                             29d
zipkin                 ClusterIP      10.98.118.194    <none>        9411/TCP                                                                     29d
# ......如果是要在生产环境中使用 Jaeger,则需要参考官方文档进行部署。
- 安装 Jaeger 完毕后,需要指定 Istio Envoy Proxy 代理向 Deployment 发送流量,可以使用
--set meshConfig.defaultConfig.tracing.zipkin.address=jaeger-collector:9411进行配置,此外默认的采样率为 1%,可以通过--set meshConfig.defaultConfig.tracing.sampling=100来修改采样率。
istioctl install --set profile=demo --set meshConfig.defaultConfig.tracing.zipkin.address=jaeger-collector:9411 --set meshConfig.defaultConfig.tracing.sampling=100 -y- 现在我们就可以通过下面的命令来查看 Jaeger UI 了:
istioctl dashboard jaeger --address 0.0.0.0

[root@master1 ~]#kubectl get istiooperators.install.istio.io -nistio-system
NAME              REVISION   STATUS   AGE
installed-state                       26d

[root@master1 ~]#kubectl get istiooperators.install.istio.io -nistio-system -oyaml
……
    meshConfig:
      accessLogFile: /dev/stdout
      defaultConfig:
        proxyMetadata: {}
        tracing:
          sampling: 100
          zipkin:
address: jaeger-collector:9411http://172.29.9.61:16686/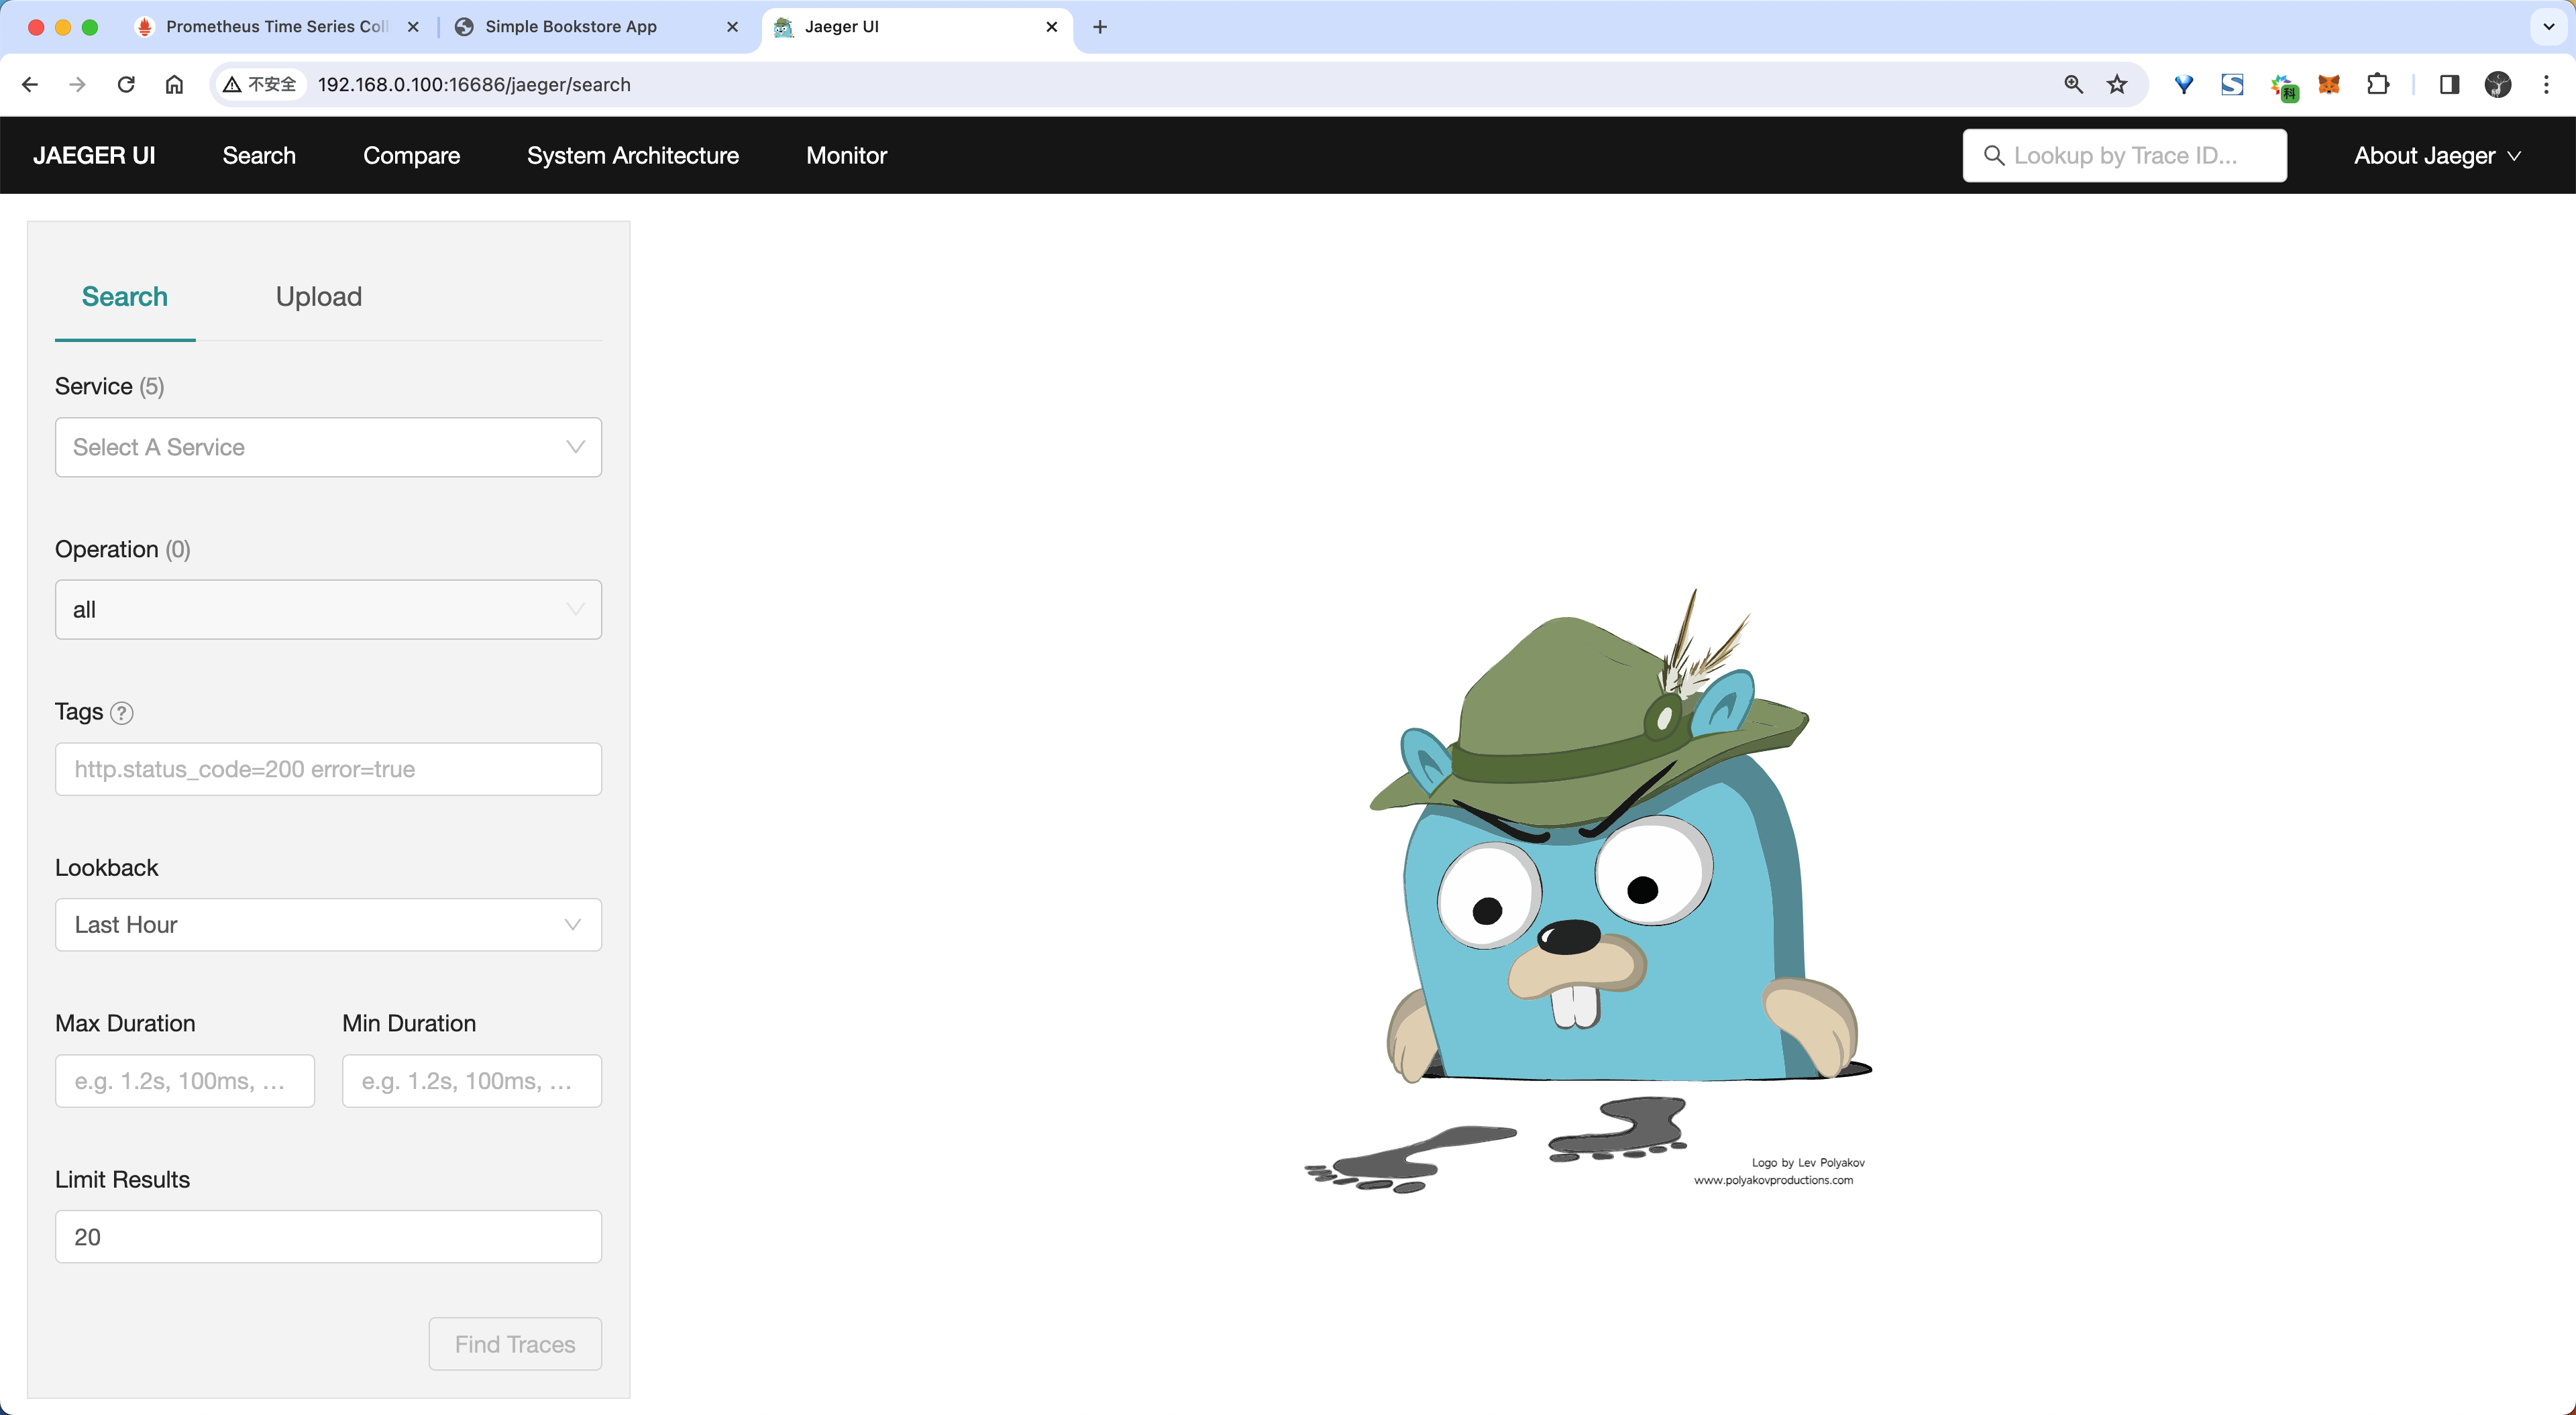
- 接下来我们只需要访问下 Bookinfo 应用,然后在 Jaeger UI 中就可以看到追踪数据了。要查看追踪数据,必须向服务发送请求。请求的数量取决于 Istio 的采样率,采样率在安装 Istio 时设置,默认采样速率为 1%。在第一个跟踪可见之前,我们需要发送至少 100 个请求。使用以下命令向 productpage 服务发送 100 个请求:
for i in $(seq 1 100); do curl -s -o /dev/null "http://$GATEWAY_URL/productpage"; done
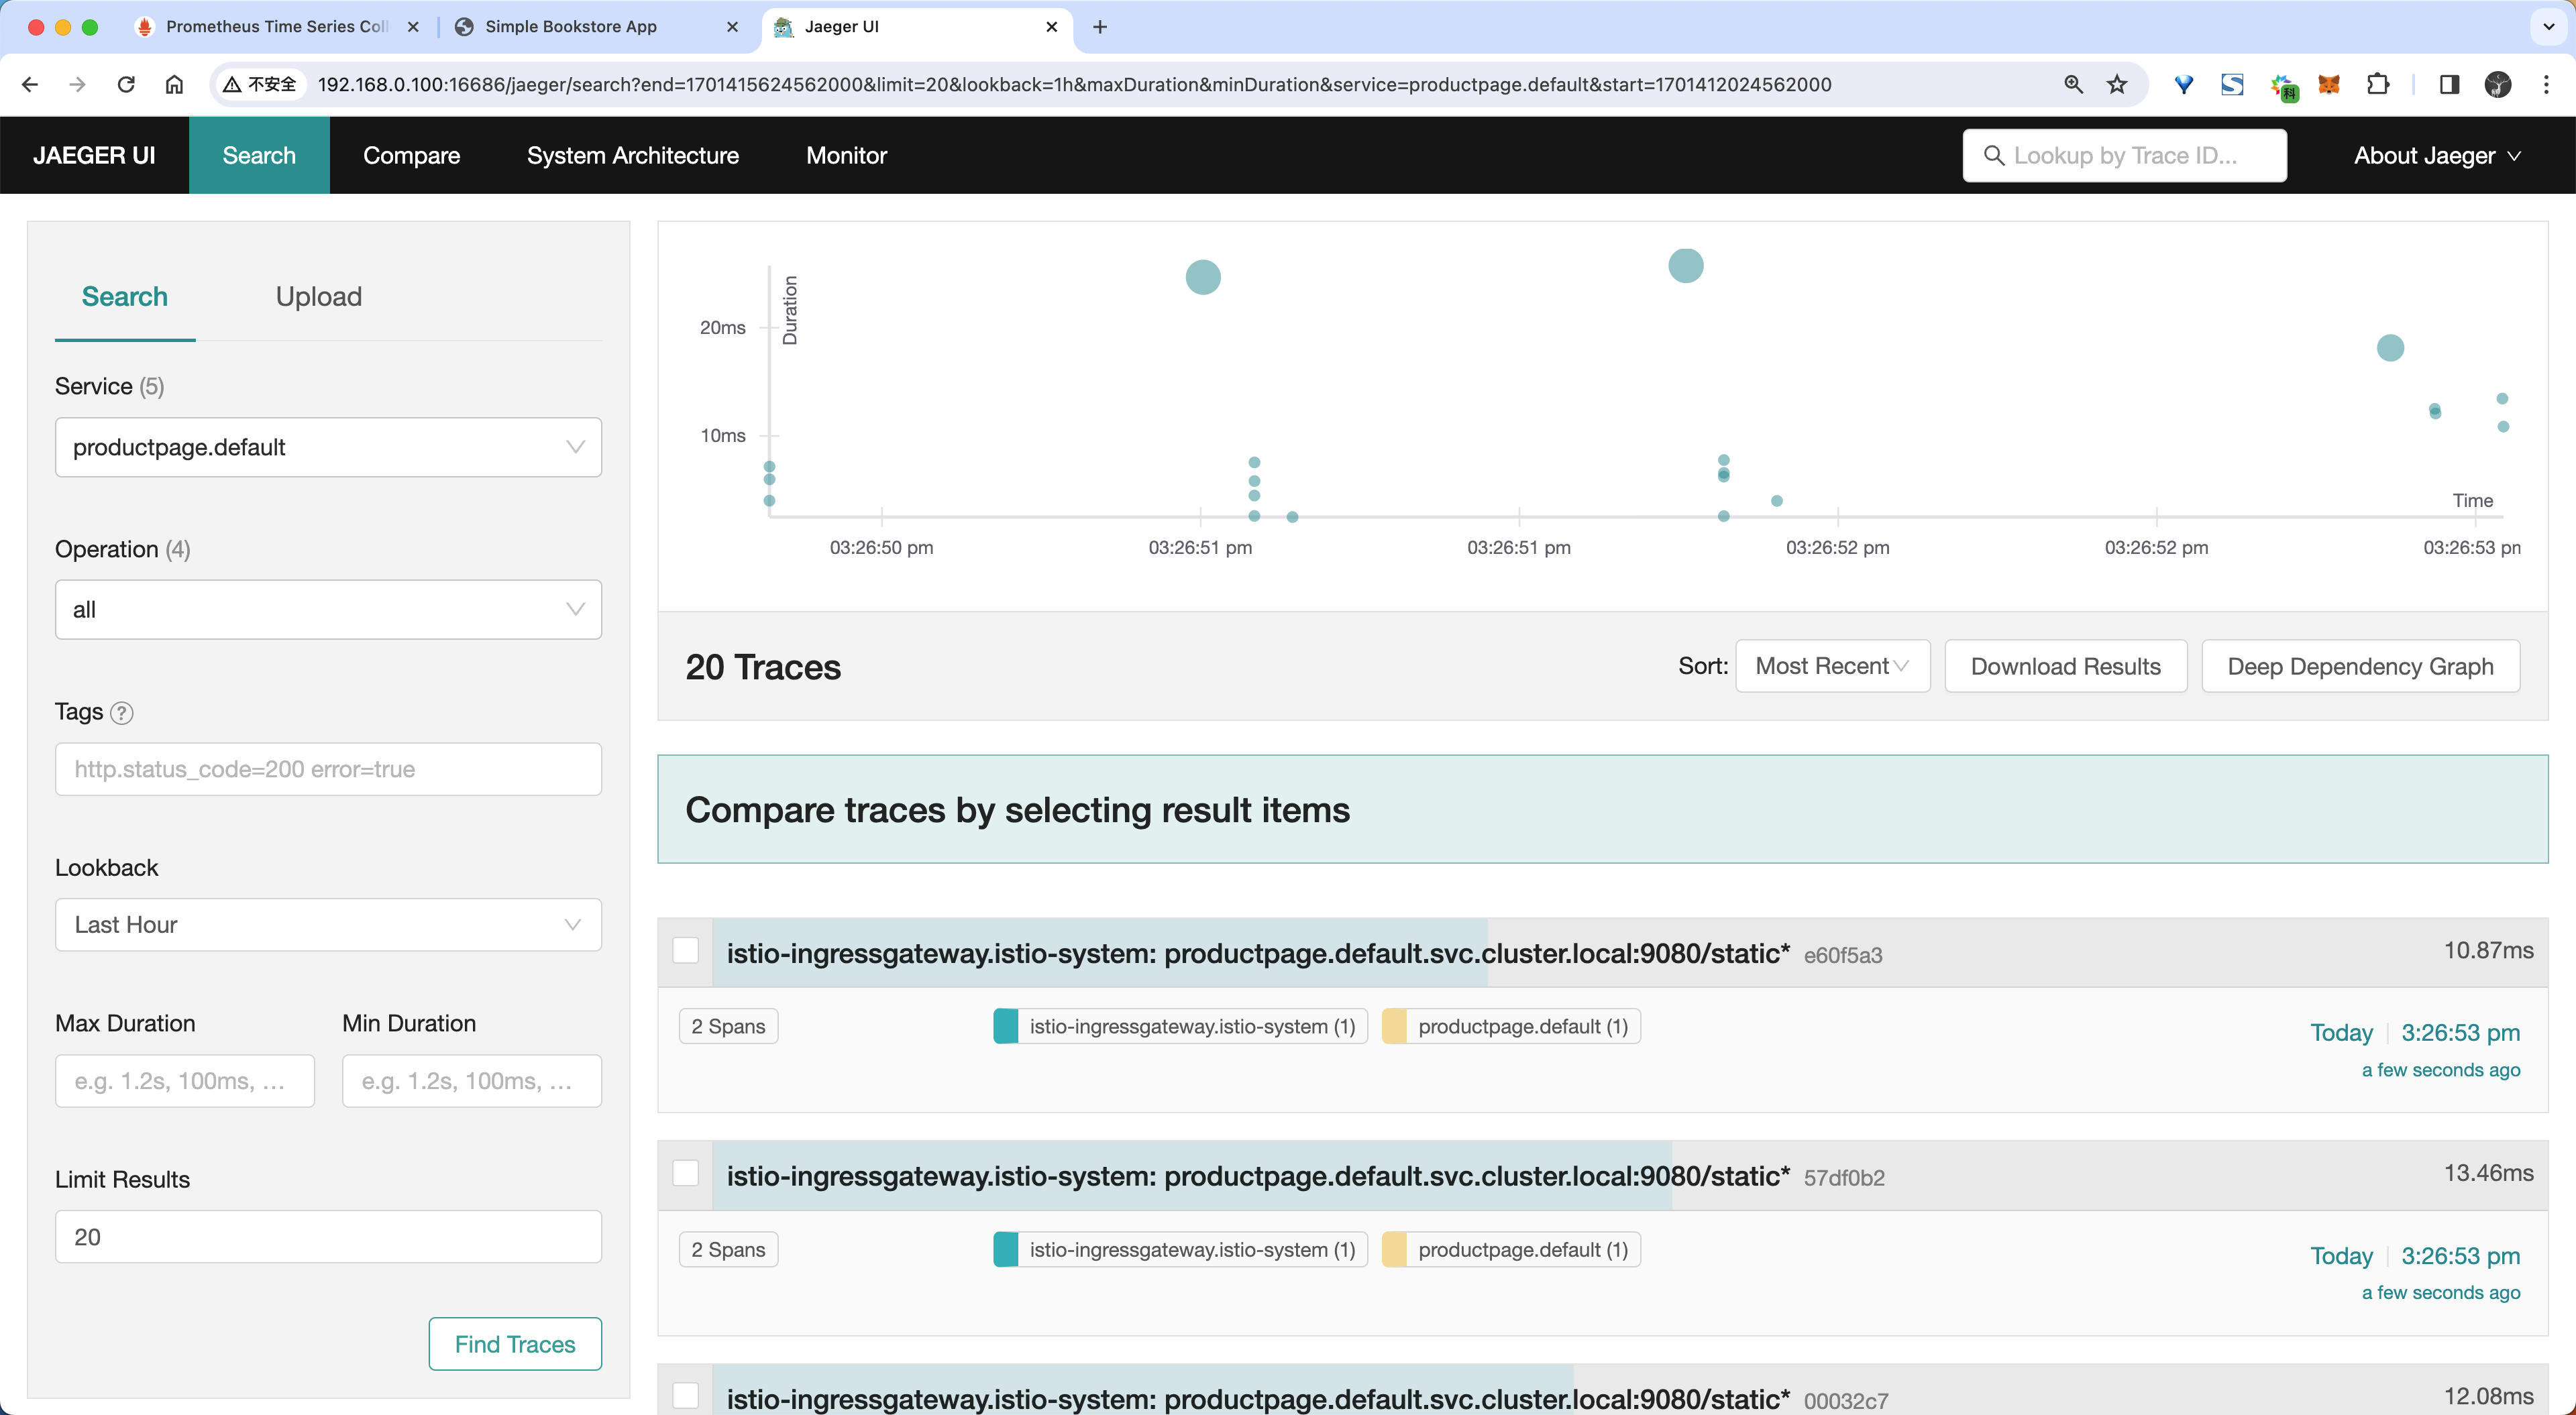
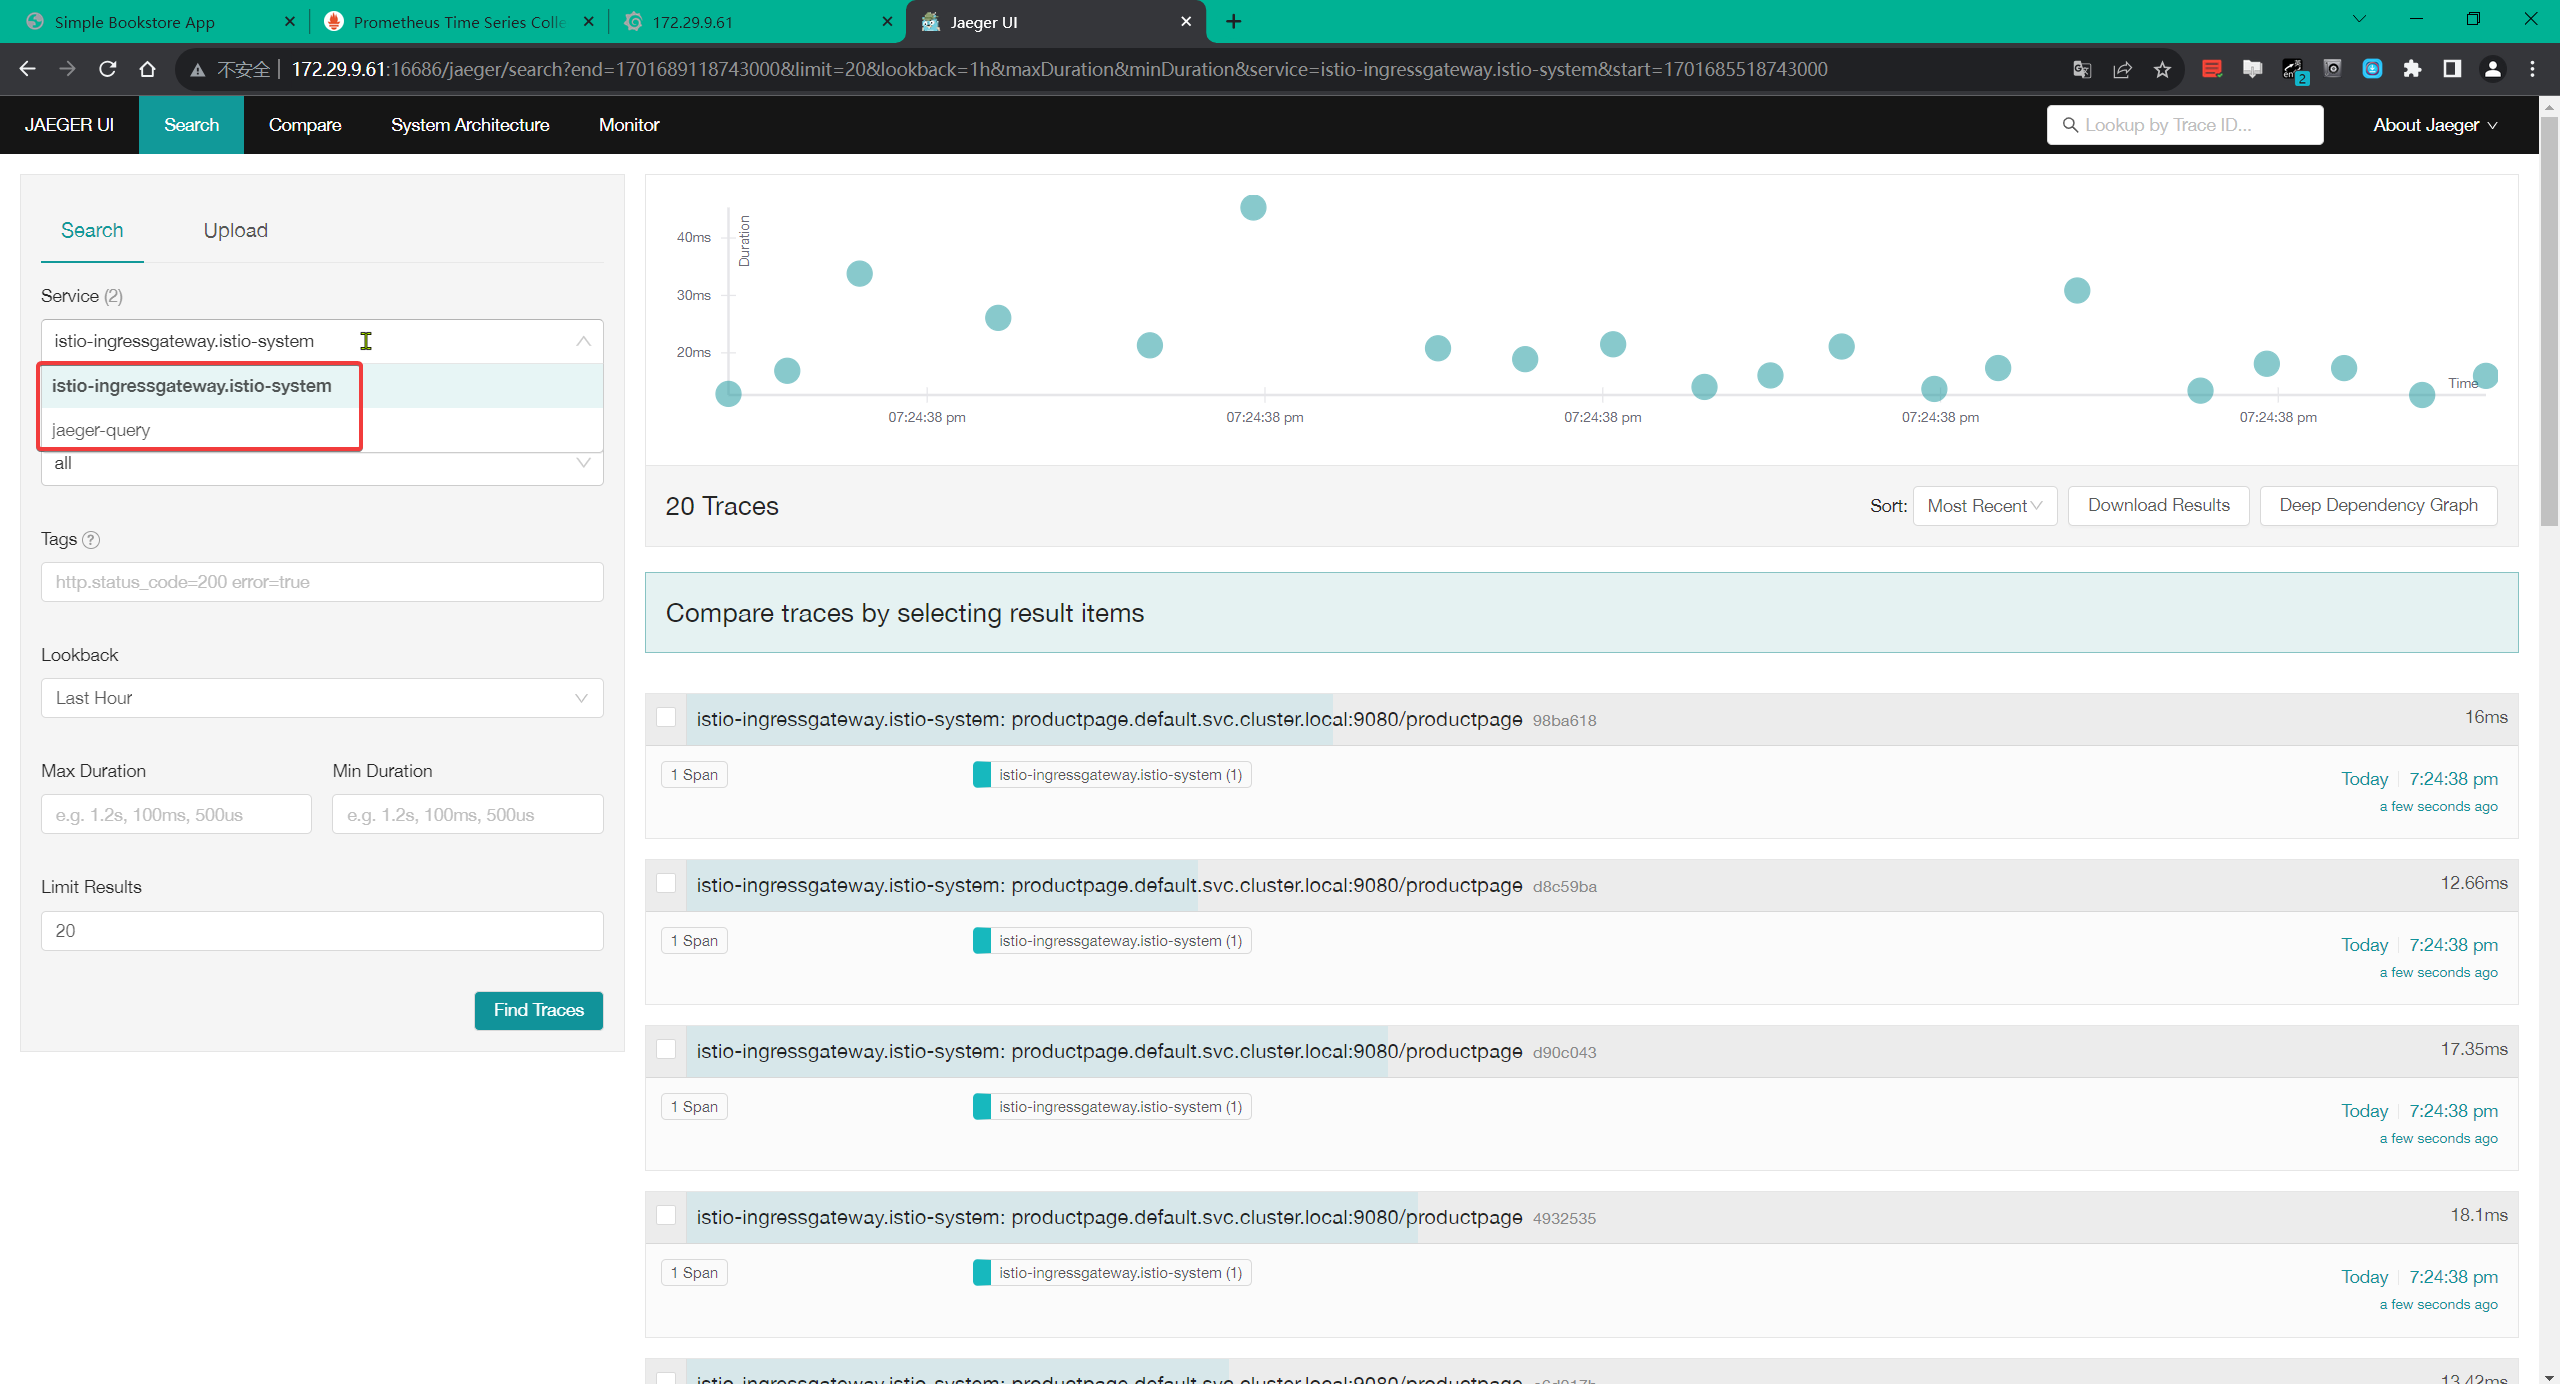
for i in $(seq 1 100); do curl -s -o /dev/null "http://172.29.9.61:31666/productpage"; done- 从仪表盘左边面板的 Service 下拉列表中选择
productpage.default并点击 Find Traces:
奇怪哇:我这里只有2个服务哦。。。
- 然后我们可以点击访问
/productpage的链路详细信息:
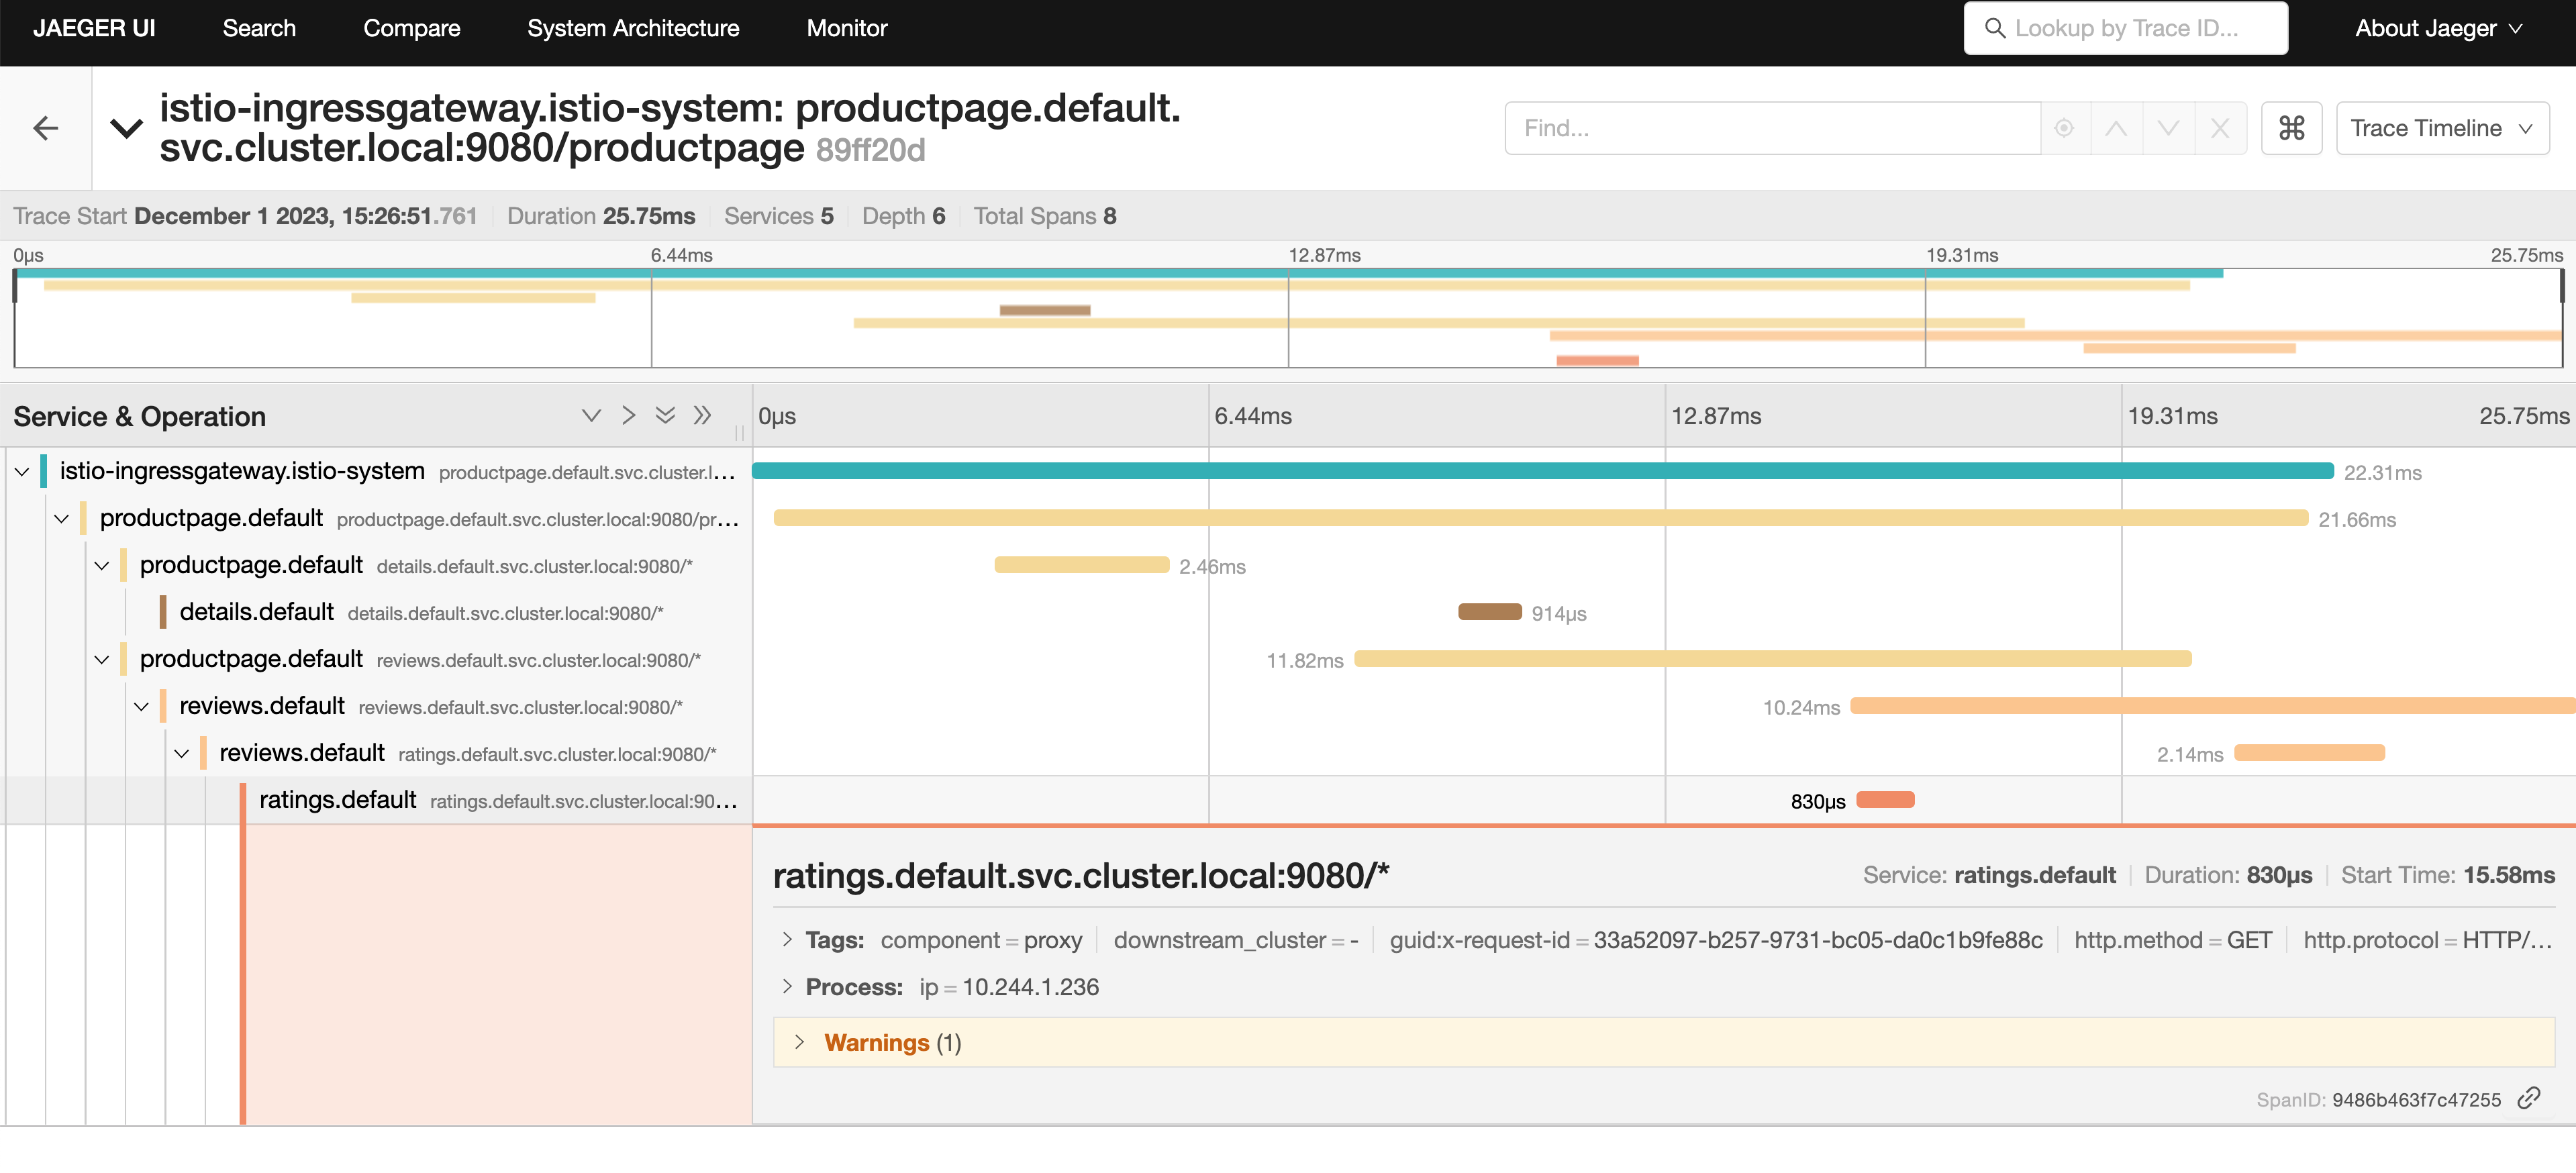
追踪信息由一组 Span 组成,每个 Span 对应一个 Bookinfo Service。这些 Service 在执行 /productpage 请求时被调用,或是 Istio 内部组件,例如:istio-ingressgateway。
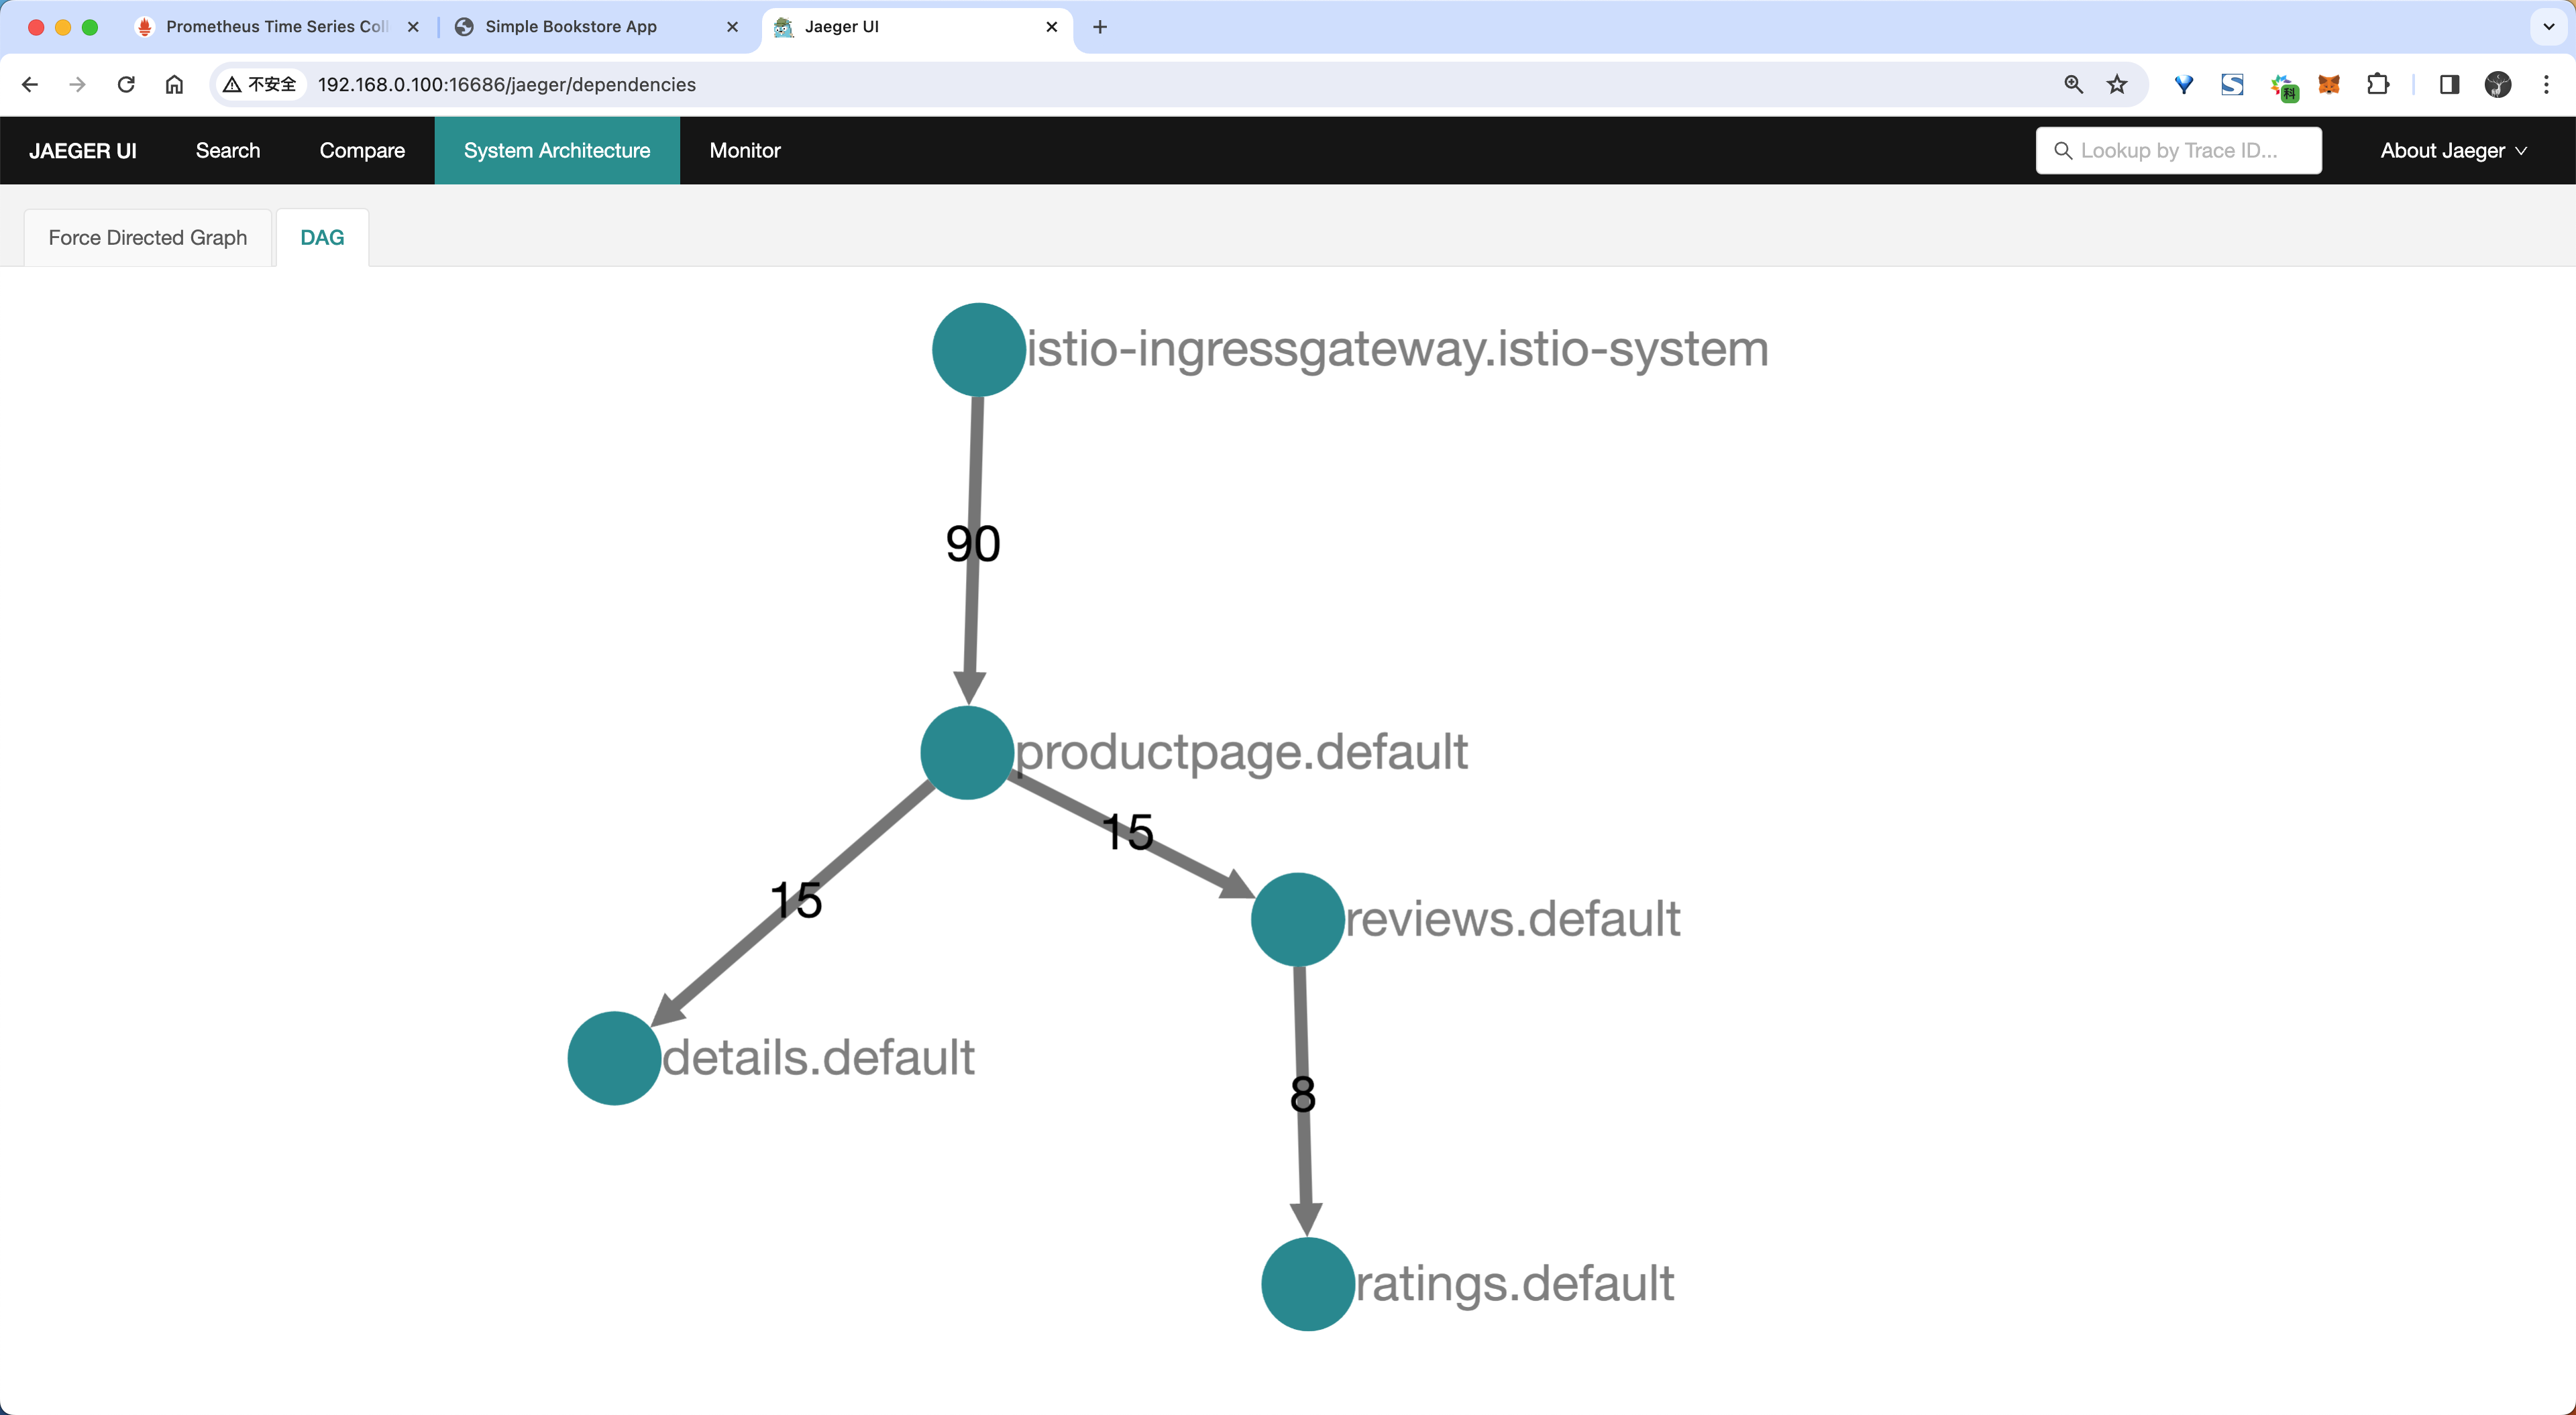
- 在系统架构页面也可以看到对应的 DAG 图:
使用 Telemetry API 配置链路追踪
通过 Istio 的 Telemetry API 提供了配置高级链路追踪选项的功能,例如采样率和向已采集的 Span 中添加自定义标签。
使用方法和自定义指标方式类似,可以通过一个 tracing 字段进行配置。
$ kubectl explain Telemetry.spec.tracing
GROUP:      telemetry.istio.io
KIND:       Telemetry
VERSION:    v1alpha1

FIELD: tracing <[]Object>

DESCRIPTION:
    Optional.

FIELDS:
  customTags    <map[string]Object>
    Optional.

  disableSpanReporting  <boolean>
    Controls span reporting.

  match <Object>
    Allows tailoring of behavior to specific conditions.

  providers     <[]Object>
    Optional.

  randomSamplingPercentage      <number>
    <no description>

  useRequestIdForTraceSampling  <boolean>
<no description>从上面可以看出关于链路追踪相关配置的主要字段有:
providers:用于 span 报告的提供者名称,如果没有指定提供者,则将使用默认的跟踪提供者。注意:目前只能指定一个提供者。randomSamplingPercentage:如果之前没有进行过采样决策,则控制选择流量进行跟踪的速率。如果已经进行了先前的采样决策,那么将使用该决策。然而,如果没有进行过采样决策(例如:请求中未包含x-b3-sampled跟踪标头),则将以指定的百分比生成遥测数据。disableSpanReporting:控制 span 上报。如果设置为true,则不会上报受影响的工作负载的 span。这不会影响上下文传播或跟踪采样行为。customTags:配置生成的 span 的其他自定义标签。match:允许根据特定条件进行行为定制。
对于 Tracing 来说,要想使用 Telemetry API,必须先在 MeshConfig 中配置相应的 Provider,然后在 TelemetryAPI 的配置中使用命名引用这个 Provider。
- 比如我们可以添加一个名为
mytrace的 Trace Provider,对应的配置如下所示:
# mytrace.yaml
apiVersion: install.istio.io/v1alpha1
kind: IstioOperator
spec:
  profile: demo # 使用 demo profile,不能忽略
  meshConfig:
    enableTracing: true
    defaultConfig:
      tracing: {} # 禁用全局的 tracing 配置
    extensionProviders:
      - name: mytrace
        zipkin: # add zipkin provider
          service: zipkin.istio-system.svc.cluster.local
port: 9411上面的配置对象中我们这 meshConfig 中首先将全局的 tracing 配置禁用掉,然后在 extensionProviders 下面添加了一个名为 mytrace 的 Trace Provider,对应的后端服务为 zipkin.istio-system.svc.cluster.local,端口为 9411,由于前面我们安装的 Jaeger 服务暴露了 9411 端口,并创建了一个名为 zipkin 的 Service 对象,所以这里我们可以直接使用 zipkin.istio-system.svc.cluster.local 来访问 Jaeger 服务,因为 Jaeger 本身也是兼容 Zipkin 协议的。
- 然后我们可以通过
istioctl命令来安装这个配置对象:
istioctl install -f mytrace.yaml -y- 配置生效后我们就可以来使用 Telemetry API 来配置链路追踪了,比如我们可以通过以下配置来启用我们创建的
mytrace这个链路追踪 Provider:
#mesh-default.yaml
apiVersion: telemetry.istio.io/v1alpha1
kind: Telemetry
metadata:
  name: mesh-default
  namespace: istio-system
spec:
  tracing:
    - providers:
- name: mytrace上面的对象我们指定的命名空间为 istio-system,表示会对整个服务网格中的工作负载应用这个配置。
- 应用上面对象后,再次访问下 productpage 应用,然后在 Jaeger UI 中就可以看到追踪数据了。
kubectl apply -f mesh-default.yaml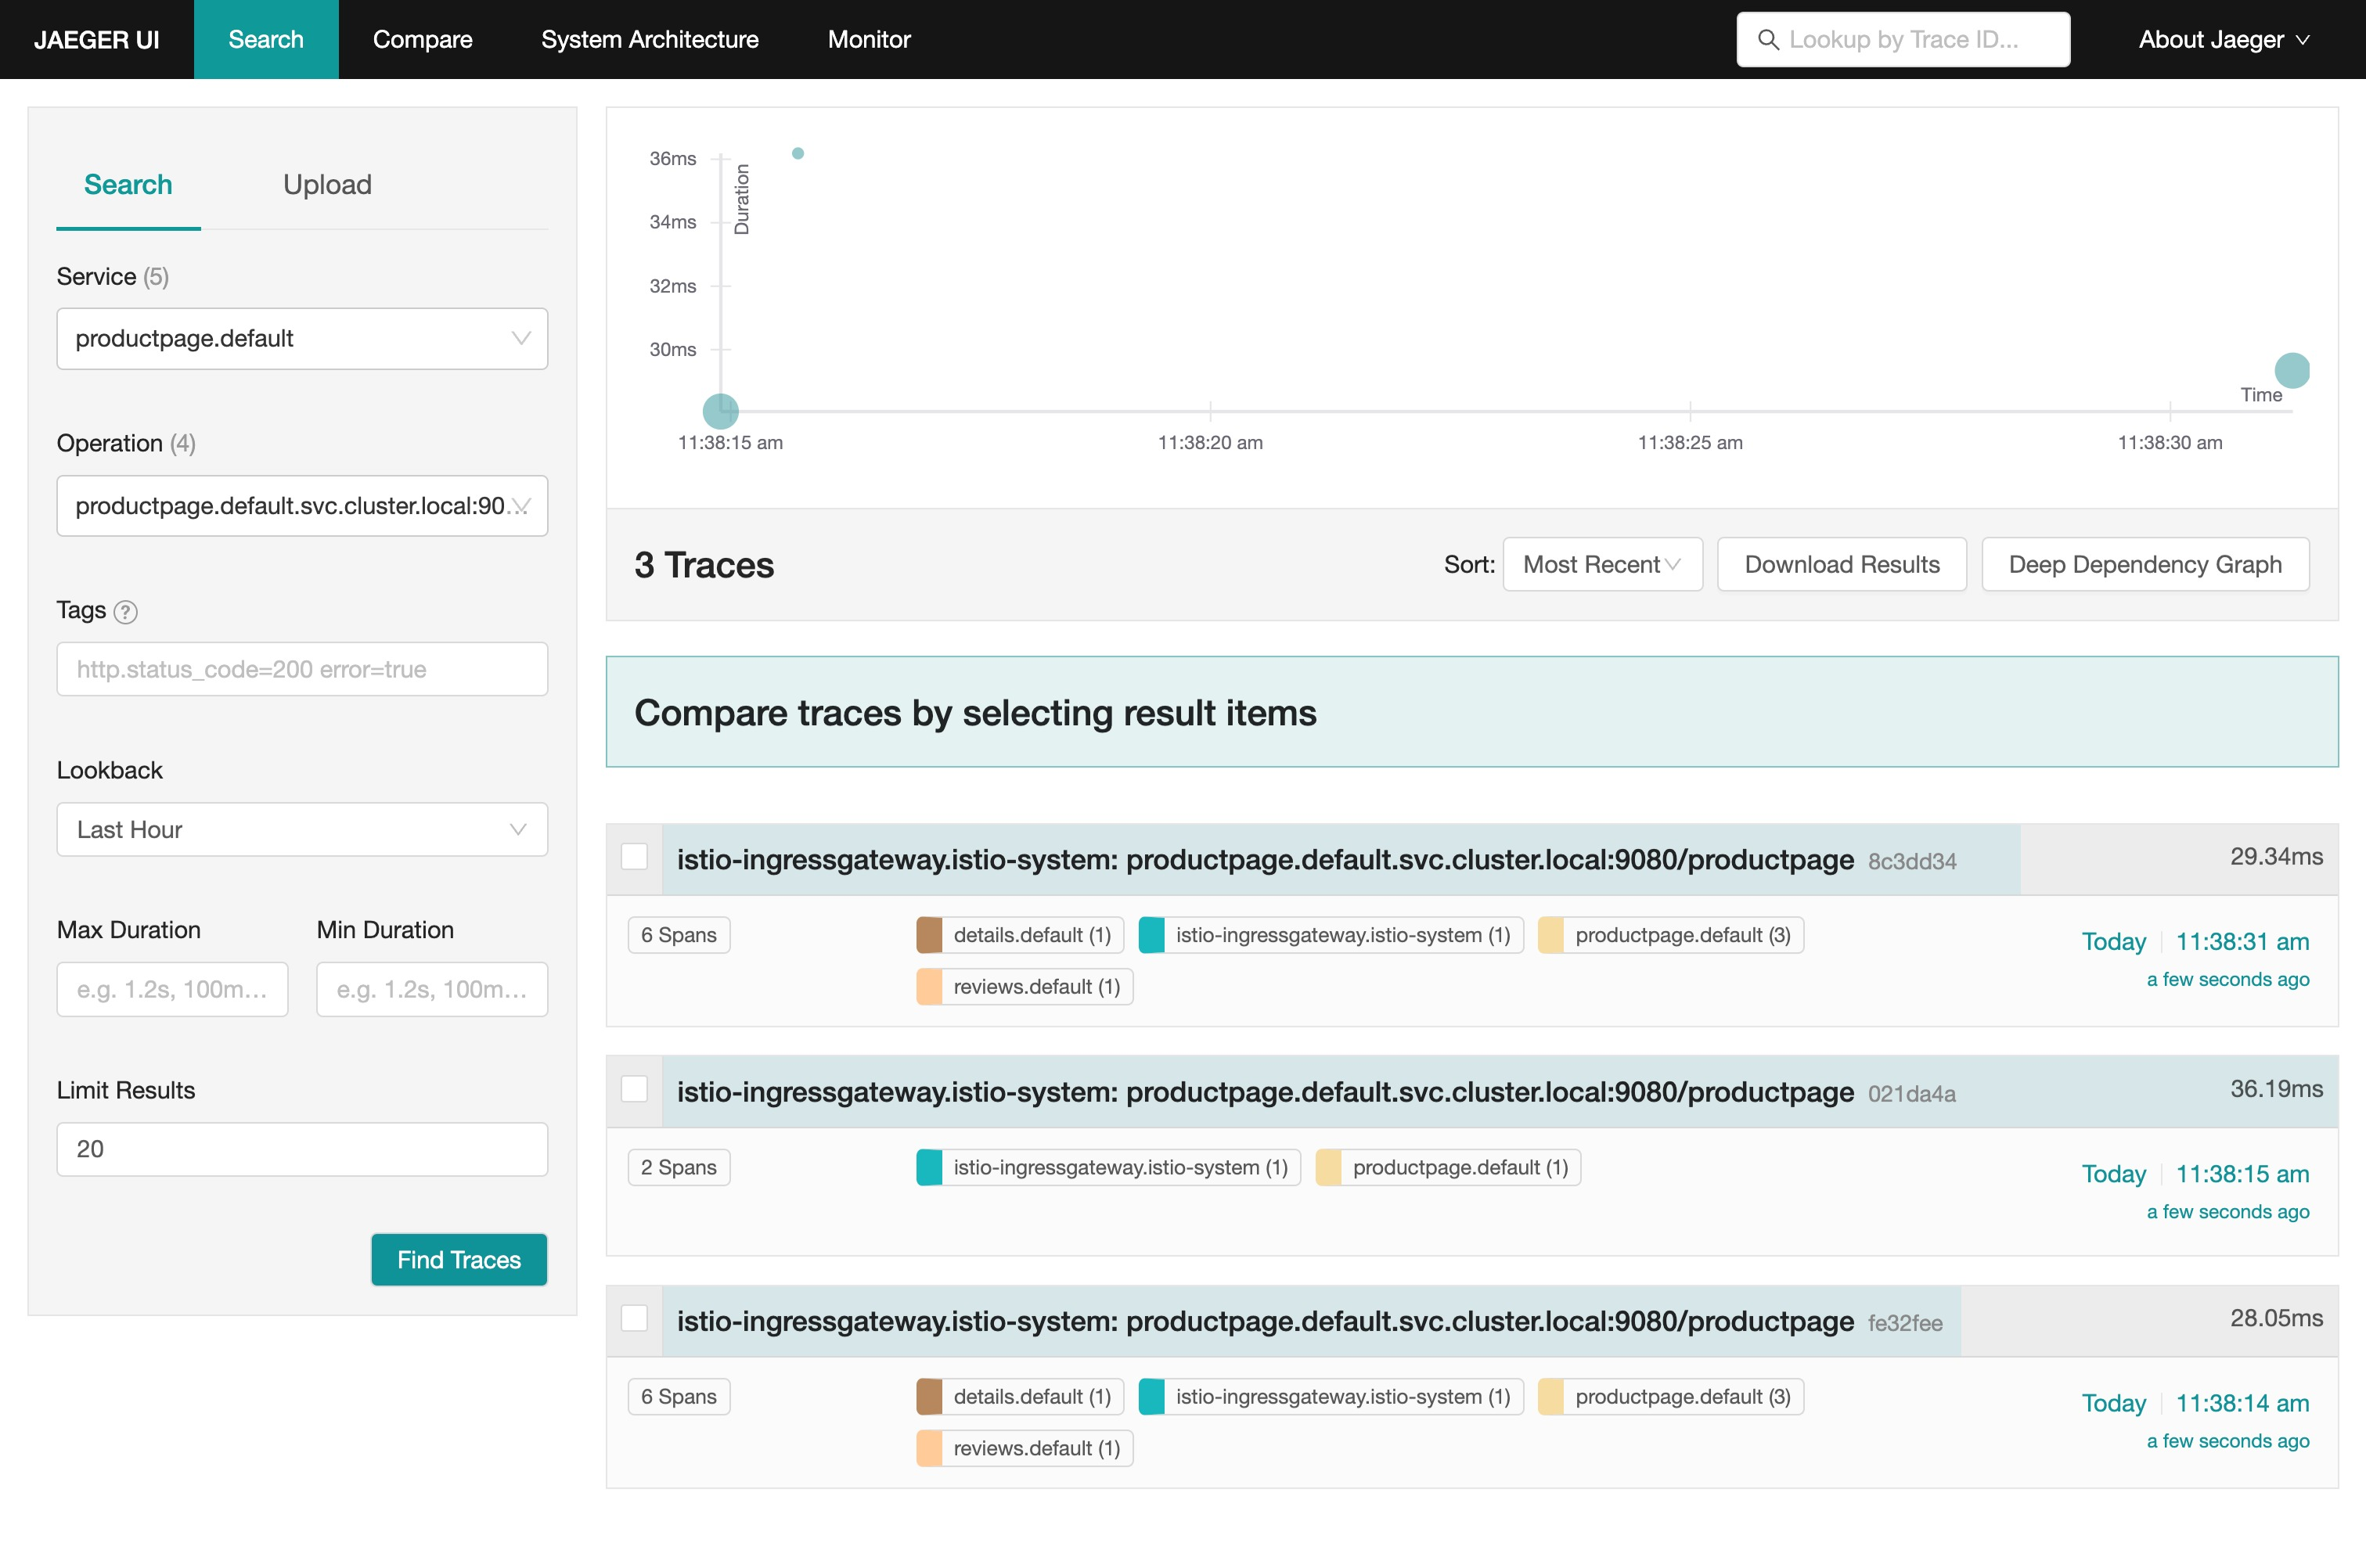
我们一共请求了 3 次 /productpage 接口, Jaeger UI 中就显示了 3 个链路,证明默认情况下通过 Telemetry 方式启用的链路追踪采样率是 100%。
- 如果现在我们要将采样率设置为 50%,则可以创建一个如下所示的资源对象:
apiVersion: telemetry.istio.io/v1alpha1
kind: Telemetry
metadata:
  name: mesh-default
  namespace: istio-system
spec:
  tracing:
    - providers:
        - name: mytrace
randomSamplingPercentage: 50同样应用上面的资源对象后,这次我们一共访问 6 次 productpage 应用,最后在 Jaeger UI 只能看到 3 个链路数据了,证明采样率已经生效了。
除了配置采样率之外,我们还可以基于文本、环境变量和客户端请求等向 spans 添加自定义标签。
添加自定义标签的数量没有限制,但标签名称必须唯一。
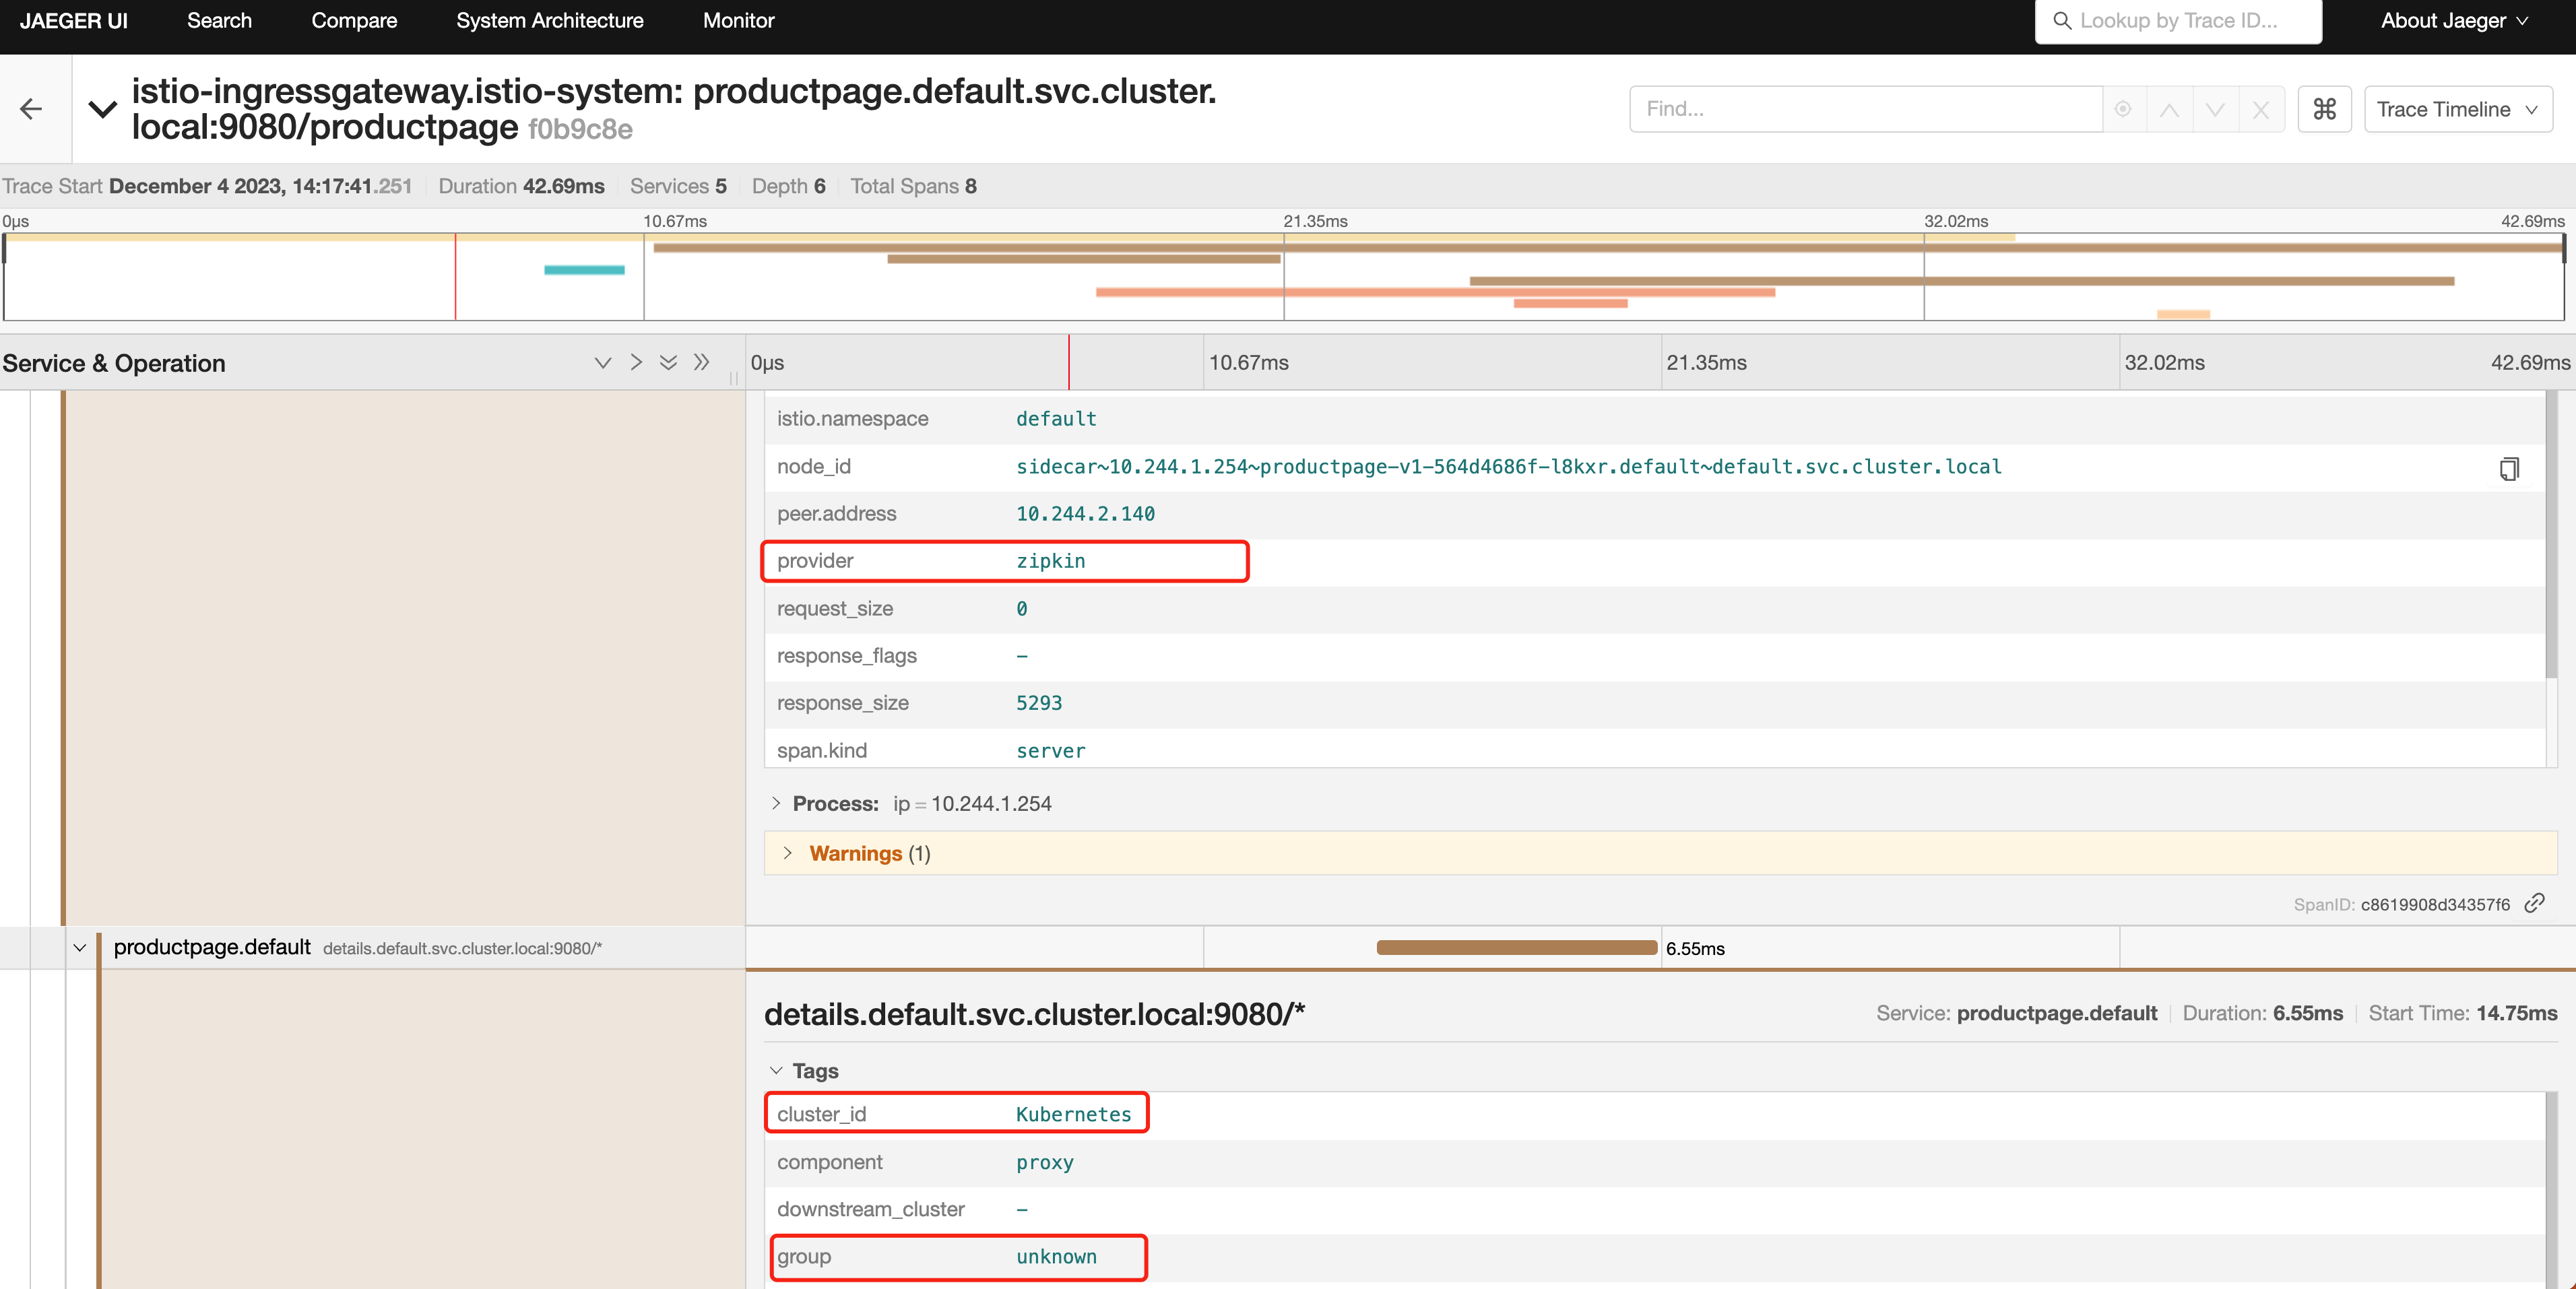
- 比如我们可以通过以下配置向 spans 添加自定义标签:
apiVersion: telemetry.istio.io/v1alpha1
kind: Telemetry
metadata:
  name: mesh-default
  namespace: istio-system
spec:
  tracing:
    - providers:
        - name: mytrace
      randomSamplingPercentage: 50
      customTags:
        "provider":
          literal:
            value: "zipkin"
        "cluster_id":
          environment:
            name: ISTIO_META_CLUSTER_ID
            defaultValue: Kubernetes
        "group":
          header:
            name: x-group
defaultValue: "unknown"上面的对象中我们在 customTags 下面添加了一个名为 provider 的标签,它的值为 zipkin,这个标签的值是一个 Literal 类型的值,Literal 表示一个静态的值,会被添加到每个 span 中。另外添加的 cluster_id 这个标签的值是通过环境变量 ISTIO_META_CLUSTER_ID 来获取的,最后添加的 group 这个标签的值是通过请求头 x-group 来获取的,如果请求头中没有 x-group 这个请求头,则使用默认值 unknown。
注意基于环境变量添加自定义标签,需要在根 Istio 系统命名空间中的
istio-sidecar-injector的 ConfigMap 中进行定义。
- 如果不通过 Telemetry API 来配置链路追踪,那么每次我们都需要去更新 Istio 的安装配置才能生效,比如要实现上面的配置,我们需要
MeshConfig的 全局配置来实现:
# mytrace.yaml
apiVersion: install.istio.io/v1alpha1
kind: IstioOperator
spec:
  profile: demo # 使用 demo profile,不能忽略
  meshConfig:
    enableTracing: true
    defaultConfig:
      tracing:
        sampling: 50
        zipkin:
          address: zipkin.istio-system.svc.cluster.local:9411
        customTags:
          "provider":
            literal:
              value: "zipkin"
          "cluster_id":
            environment:
              name: ISTIO_META_CLUSTER_ID
              defaultValue: Kubernetes
          "group":
            header:
              name: x-group
defaultValue: "unknown"- 此外如果要对指定的工作负载应用链路追踪配置,以前的方式可以通过 Deployment 的注解来定义调用链的配置信息,比如对于 Productpage 应用,我们可以通过以下方式来配置:
apiVersion: apps/v1
kind: Deployment
metadata:
  name: productpage-v1
  labels:
    app: productpage
spec:
  selector:
    matchLabels:
      app: productpage
      version: v1
  template:
    metadata:
      labels:
        app: productpage
        version: v1
      annotations:
        proxy.istio.io/config: |
          tracing:
            sampling: 50
            zipkin:
              address: zipkin.istio-system.svc.cluster.local:9411
            customTags:
              "provider":
                literal:
                  value: "zipkin"
              "cluster_id":
                environment:
                  name: ISTIO_META_CLUSTER_ID
                  defaultValue: Kubernetes
              "group":
                header:
                  name: x-group
                  defaultValue: "unknown"

# ......这种方式虽然可以达到目的,但显然不够灵活,而且需要修改 Deployment 的配置,不够优雅,侵入性太强,而通过 Telemetry API 来配置链路追踪,就可以更加灵活地配置链路追踪了,比如同样只想对 Productpage 应用进行链路追踪,可以通过以下方式来配置:
apiVersion: telemetry.istio.io/v1alpha1
kind: Telemetry
metadata:
  name: productpage
  namespace: default # 指定要配置的工作负载所在命名空间
spec:
  selector:
    matchLabels:
      app: productpage # 关联工作负载的标签
  tracing:
    - providers:
        - name: mytrace
      randomSamplingPercentage: 50
      customTags:
        "provider":
          literal:
            value: "zipkin"
        "cluster_id":
          environment:
            name: ISTIO_META_CLUSTER_ID
            defaultValue: Kubernetes
        "group":
          header:
            name: x-group
defaultValue: "unknown"到这里我们就了解了如何通过 Telemetry API 来配置链路追踪了,这种方式显示是更推荐的方式,更加灵活。
3、访问日志
访问日志提供了一种从单个工作负载实例的角度监控和理解行为的方法,同样访问日志是我们在生产环境中必不可少的一种监控手段,Istio 通过 Envoy 来提供访问日志功能,Envoy Proxy 打印访问信息到标准输出,Envoy 容器的标准输出能够通过 kubectl logs 命令打印出来。
Istio 能够以一组可配置的格式为服务流量生成访问日志,使运维人员可以完全控制日志记录的方式、内容、时间和地点。 下面是一个典型的 Istio 访问日志示例:
[2023-12-04T06:17:42.719Z] "GET /productpage HTTP/1.1" 200 - via_upstream - "-" 0 5289 23 22 "10.244.0.0" "Mozilla/5.0 (Macintosh; Intel Mac OS X 10_15_7) AppleWebKit/537.36 (KHTML, like Gecko) Chrome/119.0.0.0 Safari/537.36" "f3a98cd1-6970-42c0-9c86-d179b93aa779" "192.168.0.100:31896" "10.244.1.254:9080" inbound|9080|| 127.0.0.6:45629 10.244.1.254:9080 10.244.0.0:0 outbound_.9080_._.productpage.default.svc.cluster.local default在现在的 Telemetry V2 版本的架构中,访问日志直接通过服务网格的数据平面 Envoy 上生成并上报给日志后端。根据后端日志采集方式的不同,会有不同的通道和方式。Envoy 可以通过控制台或者文件输出,由各种日志代理采集,也可以通过 gRPC 协议直接上报日志给标准的访问日志服务 ALS(Envoy Access Log Service),比如 Skywalking 就支持这种方式。
一般流程如下所示:
- Envoy 根据服务网格配置提取应用的访问信息
- 上报访问日志,比如通过 gRPC 协议上报给 ALS 服务
- ALS 服务 对接后端,将日志写到 Elasticsearch、Kafka 等后端服务中
- 通过 Kibanba、Grafana 等工具从后端服务检索日志
开启 Envoy 访问日志
同样的方式在 Istio 中我们可以通过 MeshConfig 和 Telemetry API 的方式来启用访问日志。
如果想通过 MeshConfig 方式来配置,需要在安装配置中添加以下字段(默认已经配置了):
spec:
  meshConfig:
accessLogFile: /dev/stdout或者,在原来的 istioctl install 命令中添加相同的设置,例如:
istioctl install <flags-you-used-to-install-Istio> --set meshConfig.accessLogFile=/dev/stdout此外还可以通过设置 accessLogEncoding 为 JSON 或 TEXT 来配置日志的格式。另外还可以设置 accessLogFormat 来自定义访问日志的格式,如果没有指定 accessLogFormat 的话 Istio 将使用以下默认的访问日志格式:
[%START_TIME%] \"%REQ(:METHOD)% %REQ(X-ENVOY-ORIGINAL-PATH?:PATH)% %PROTOCOL%\" %RESPONSE_CODE% %RESPONSE_FLAGS% %RESPONSE_CODE_DETAILS% %CONNECTION_TERMINATION_DETAILS%
\"%UPSTREAM_TRANSPORT_FAILURE_REASON%\" %BYTES_RECEIVED% %BYTES_SENT% %DURATION% %RESP(X-ENVOY-UPSTREAM-SERVICE-TIME)% \"%REQ(X-FORWARDED-FOR)%\" \"%REQ(USER-AGENT)%\" \"%REQ(X-REQUEST-ID)%\"
\"%REQ(:AUTHORITY)%\" \"%UPSTREAM_HOST%\" %UPSTREAM_CLUSTER% %UPSTREAM_LOCAL_ADDRESS% %DOWNSTREAM_LOCAL_ADDRESS% %DOWNSTREAM_REMOTE_ADDRESS% %REQUESTED_SERVER_NAME% %ROUTE_NAME%\n当然我们还是强烈推荐使用 Telemetry API 来开启或关闭访问日志,如下所示:
apiVersion: telemetry.istio.io/v1alpha1
kind: Telemetry
metadata:
  name: mesh-default
  namespace: istio-system
spec:
  accessLogging:
    - providers:
- name: envoy上面的示例使用默认的 envoy 访问日志提供程序,当然我们也可以应用于单独的命名空间或单独的工作负载,以在细粒度级别控制日志记录。
Grafana Loki
接下来我们来将访问日志发送到 Grafana Loki 进行统一的日志管理,Loki 是一个水平可扩展、高可用的多租户日志聚合系统。
- 首先我们需要先确保 Loki 已经安装,我们这里同样只是为了测试,直接使用下面的方式安装即可,如果在生产环境中使用,则需要参考官方文档进行分布式部署。
kubectl apply -f samples/addons/loki.yaml -n istio-system注意:安装这个pod要pv环境哦
Events:
  Type     Reason            Age                From               Message
  ----     ------            ----               ----               -------
Warning FailedScheduling 34s (x2 over 35s) default-scheduler 0/3 nodes are available: pod has unbound immediate PersistentVolumeClaims. preemption: 0/3 nodes are available: 3 Preemption is not helpful for scheduling..由于 Istio 默认并没有直接支持 Loki 这个 Provider,我们可以查看 MeshConfig 的 ExtensionProvider 字段,可以看到 Istio 默认支持的 Provider 有:
| 字段 | 类型 | 描述 | 是否必需 |
|---|---|---|---|
name | string | 必填。用于唯一标识扩展提供商的名称。 | 否 |
envoyExtAuthzHttp | EnvoyExternalAuthorizationHttpProvider (oneof) | 配置实现了 Envoy ext_authz 过滤器授权检查服务的外部授权器,使用 HTTP API。 | 否 |
envoyExtAuthzGrpc | EnvoyExternalAuthorizationGrpcProvider (oneof) | 配置实现了 Envoy ext_authz 过滤器授权检查服务的外部授权器,使用 gRPC API。 | 否 |
zipkin | ZipkinTracingProvider (oneof) | 配置使用 Zipkin API 的跟踪提供商。 | 否 |
datadog | DatadogTracingProvider (oneof) | 配置 Datadog 跟踪提供商。 | 否 |
stackdriver | StackdriverProvider (oneof) | 配置 Stackdriver 提供商。 | 否 |
skywalking | SkyWalkingTracingProvider (oneof) | 配置 Apache SkyWalking 提供商。 | 否 |
opentelemetry | OpenTelemetryTracingProvider (oneof) | 配置 OpenTelemetry 跟踪提供商。 | 否 |
prometheus | PrometheusMetricsProvider (oneof) | 配置 Prometheus 指标提供商。 | 否 |
envoyFileAccessLog | EnvoyFileAccessLogProvider (oneof) | 配置 Envoy 文件访问日志提供商。 | 否 |
envoyHttpAls | EnvoyHttpGrpcV3LogProvider (oneof) | 针对 HTTP 流量配置 Envoy 访问日志服务提供商。 | 否 |
envoyTcpAls | EnvoyTcpGrpcV3LogProvider (oneof) | 针对 TCP 流量配置 Envoy 访问日志服务提供商。 | 否 |
envoyOtelAls | EnvoyOpenTelemetryLogProvider (oneof) | 配置 Envoy Open Telemetry 访问日志服务提供商。 | 否 |
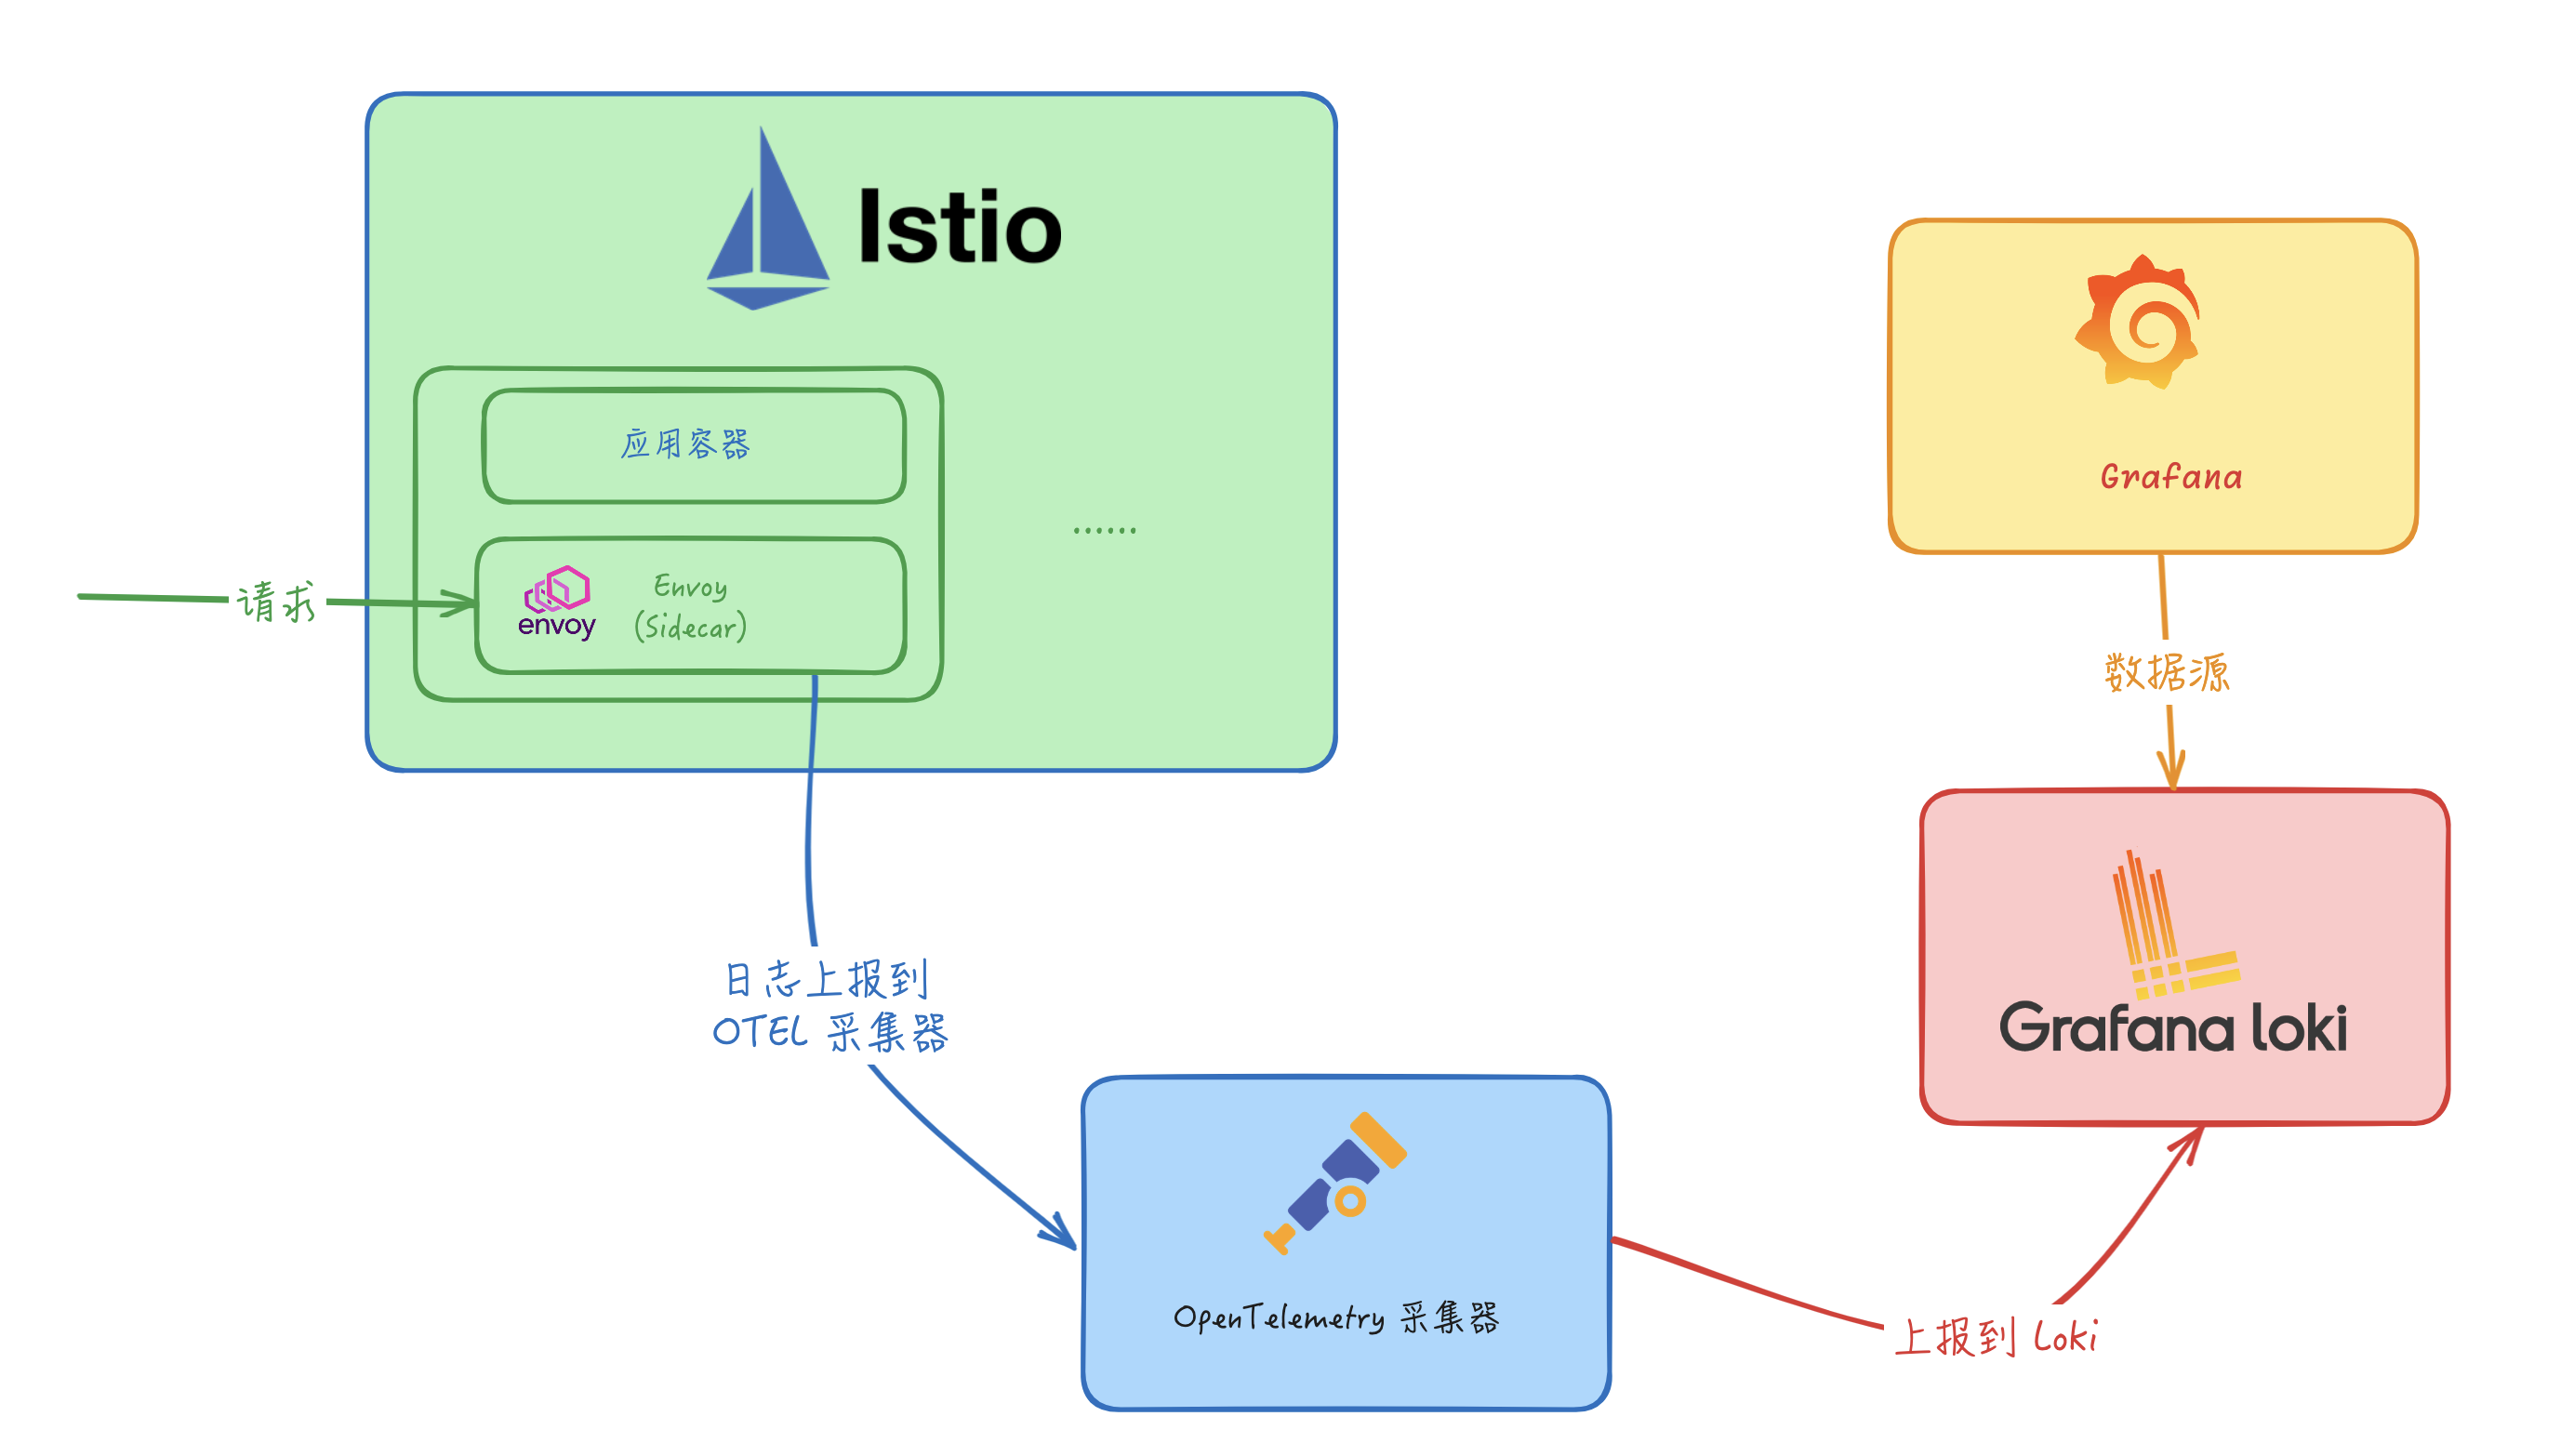
没有 Loki 这个 Provider,那么我们需要怎样才能将日志发送到 Loki 中呢?这里我们可以使用 OpenTelemetry 来收集日志,然后再通过 OpenTelemetry Collector 来将日志发送到 Loki 中。
OpenTelemetry
OpenTelemetry(简称 OTel) 是一个开源的可观测框架,用于生成、收集和描述应用程序的观测数据。它提供了一组 API、库、Agent 和 Collector,用于捕获分布式跟踪和度量数据,并将其发送到分析软件、存储库或其他服务,OTel 的目标是提供一套标准化、与厂商无关的 SDK、API 和工具集,用于将数据摄取、转换和发送到可观测性后端(开源或商业厂商)。
1.OpenTelemetry Collector
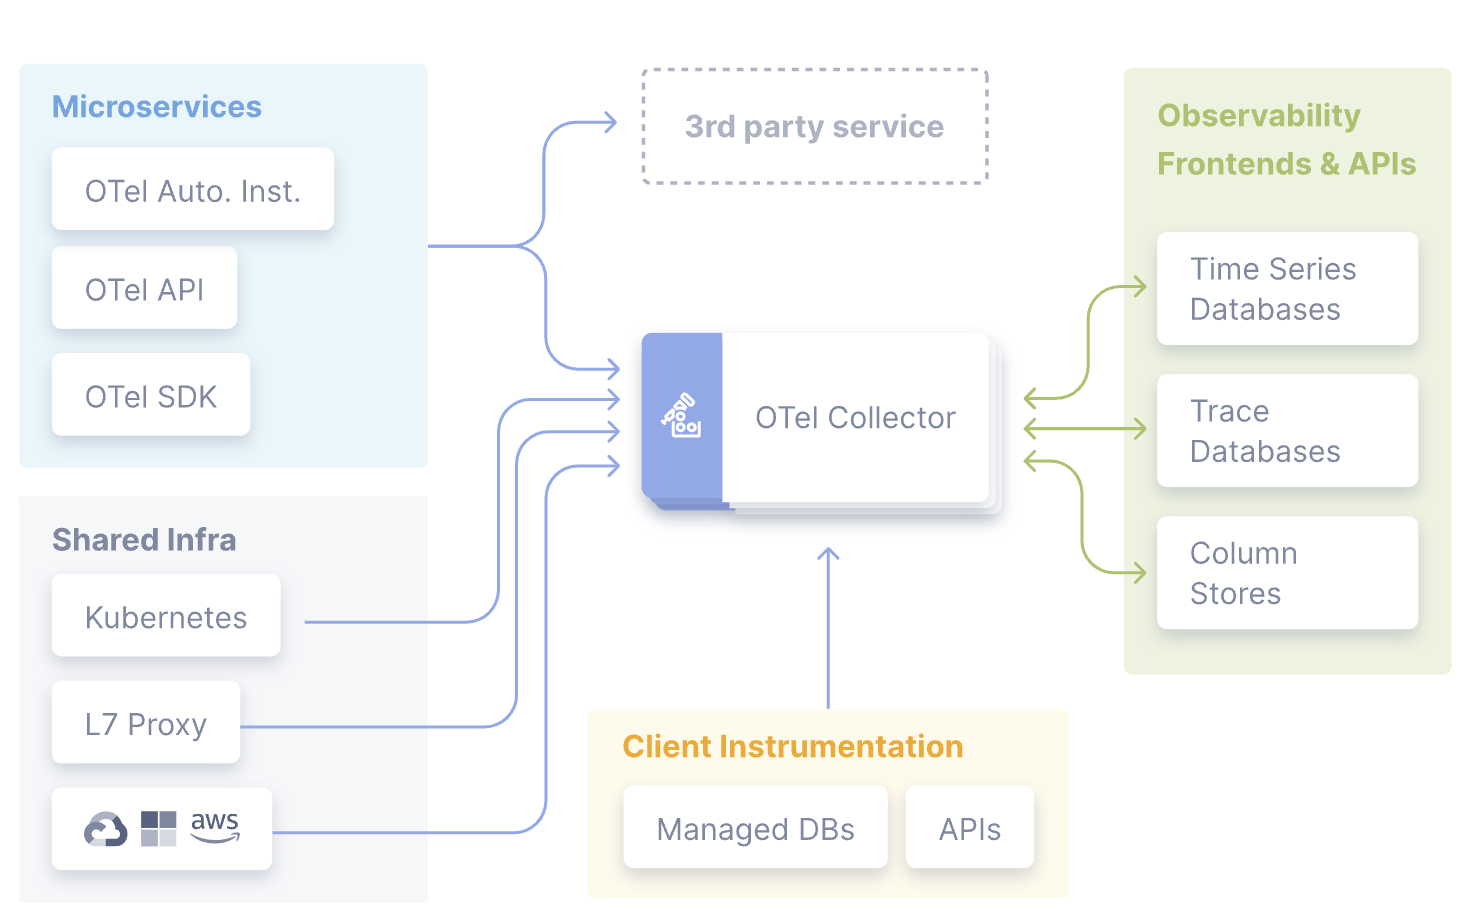
OpenTelemetry Collector 提供了一个与厂商无关的实现方式,用于接收、处理和导出遥测数据,它消除了运行、操作和维护多个代理/收集器的需求。
事实上收集器也并不是必需的,有的时候我们可以直接将遥测数据发送到外部的可视化工具中,比如 Jaeger、Zipkin 等等,但是这样的话我们就需要在每个应用中都进行配置,这样的话就会导致配置非常繁琐,而且也不利于统一管理,所以这里我们就可以使用 OpenTelemetry Collector 来解决这个问题。
而且 OpenTelemetry Collector 本身部署起来也非常灵活,可以将其部署为代理或网关。区别在于作为代理时,收集器实例与应用程序在同一主机上运行(sidecar 容器、daemonset 等)。此外一个或多个收集器实例也可以作为独立服务以每个集群、数据中心和地区的网关形式运行。
一般来说建议新应用选择代理部署,现有应用选择网关部署的方式,如果是 Kubernetes 环境,当然更建议部署为守护进程(代理模式)的方式。
收集器由四个组件组成,通过管道(Pipeline)进行启用:
- 接收器(Receiver)将数据发送到收集器中,可以通过推送或拉取方式发送
- 处理器(Processor)决定如何处理接收到的数据
- 导出器(Exporter)决定将数据发送到哪里,可以通过拉取或推送方式完成,上面代码中的
OTLPTraceExporter就是一个导出器 - 连接器(Connectors):连接器既是输出者又是接收者。连接器连接两个管道:它作为一个管道末端的导出器消耗数据,并作为另一个管道开始处的接收器发出数据。它可以消耗和发出相同数据类型或不同数据类型的数据。
当然我们也可以基于社区的组件进行自定义,以增强和扩展收集器管道。例如我们可以创建一个专用的导出器来接收并摄取指标、追踪和日志。
2.OpenTelemetry Collector 部署
在了解了 OpenTelemetry 的相关概念后,接下来我们需要部署 OpenTelemetry Collector,同样我们直接使用 Istio 提供的 samples 中的配置即可:
kubectl apply -f samples/open-telemetry/loki/otel.yaml -n istio-system该命令会部署一个 OpenTelemetry 采集器,其中比较重要的是该采集器的配置:
apiVersion: v1
kind: ConfigMap
metadata:
  name: opentelemetry-collector-conf
  labels:
    app: opentelemetry-collector
data:
  opentelemetry-collector-config: |
    receivers:
      otlp:
        protocols:
          grpc:
          http:
    processors:
      batch:
      attributes:
        actions:
        - action: insert
          key: loki.attribute.labels
          value: pod, namespace,cluster,mesh
    exporters:
      loki:
        endpoint: "http://loki.istio-system.svc:3100/loki/api/v1/push"
      logging:
        loglevel: debug
    extensions:
      health_check:
    service:
      extensions:
      - health_check
      pipelines:
        logs:
          receivers: [otlp]
          processors: [attributes]
exporters: [loki, logging]上面的配置中我们主要关注 exporters 字段,其中 loki 就是我们要将日志发送到的 Loki 服务,endpoint 字段指定了 Loki 服务的地址,这里我们直接使用 Loki 的 Service 名称即可,因为 Loki 服务暴露了 3100 端口,所以我们可以直接使用 http://loki.istio-system.svc:3100/loki/api/v1/push 来访问 Loki 服务。而 receivers 字段表示接收器,这里配置的是 otlp,表示使用 OpenTelemetry 的 OTLP 标准协议来接收数据。processors 字段表示处理器,这里我们使用了 attributes 处理器,它的作用是向日志中添加一些自定义的属性,比如 pod、namespace、cluster、mesh 等等,这样我们在 Loki 中就可以通过这些属性来进行检索了。最后需要注意的是必须要在 service.pipelines 中明确声明要启用的管道以及管道中使用的接收器、处理器和导出器,否则不会生效。
现在在 Istio 根命名空间中包含如下的一些工作负载:
$ kubectl get pods -n istio-system
NAME                                       READY   STATUS    RESTARTS         AGE
grafana-5f9b8c6c5d-jv65v                   1/1     Running   16 (5h12m ago)   32d
istio-egressgateway-556f6f58f4-mqp5z       1/1     Running   0                4h26m
istio-ingressgateway-9c8b9b586-p2w67       1/1     Running   0                4h26m
istiod-644f5d55fc-dlktv                    1/1     Running   0                4h26m
jaeger-db6bdfcb4-9s8lr                     1/1     Running   0                3h47m
kiali-7c9d5f9f96-cp4mb                     1/1     Running   18 (5h12m ago)   32d
loki-0                                     1/1     Running   0                32m
opentelemetry-collector-5ccc9c9c55-msg5x   1/1     Running   0                60s
prometheus-5d5d6d6fc-lfz87 2/2 Running 2 (5h12m ago) 2d19h接下来我们就需要在 Istio 中添加一个 OpenTelemetry 访问日志服务的 Provider,添加如下配置:
# iop.yaml
apiVersion: install.istio.io/v1alpha1
kind: IstioOperator
spec:
  profile: demo
  meshConfig:
    extensionProviders:
      - name: otel
        envoyOtelAls:
          service: opentelemetry-collector.istio-system.svc.cluster.local
          port: 4317
          logFormat:
            labels:
              pod: "%ENVIRONMENT(POD_NAME)%"
              namespace: "%ENVIRONMENT(POD_NAMESPACE)%"
              cluster: "%ENVIRONMENT(ISTIO_META_CLUSTER_ID)%"
mesh: "%ENVIRONMENT(ISTIO_META_MESH_ID)%"在上面的配置中我们添加了一个名为 otel 的 Provider,该 Provider 是一个 envoyOtelAls,表示使用 OpenTelemetry 的访问日志服务,对应的后端服务为 opentelemetry-collector.istio-system.svc.cluster.local,端口为 4317,这里我们直接使用 OpenTelemetry Collector 的 Service 名称即可。最后我们还配置了 logFormat,表示日志的格式,这里我们添加了一些自定义的属性,比如 pod、namespace、cluster、mesh 等等,然后在 OpenTelemetry 采集器中会把这些属性转换为 Loki 的标签,这样我们在 Loki 中就可以通过这些属性来进行检索了。
直接使用 istioctl 命令来安装配置该对象即可:
istioctl install -f iop.yaml -y到这里我们的准备工作就完成了。
3.使用 Telemetry API 配置访问日志
接下来我们只需要通过 Telemetry API 来启用上面我们配置的日志 Provider 就可以开始收集日志了,如下所示:
apiVersion: telemetry.istio.io/v1alpha1
kind: Telemetry
metadata:
  name: mesh-logging-default
  namespace: istio-system
spec:
  accessLogging:
    - providers:
- name: otel应用该资源对象后,整个服务网格的日志就都会被上报到 OTel 采集器,然后在 Loki 中就可以看到日志了。
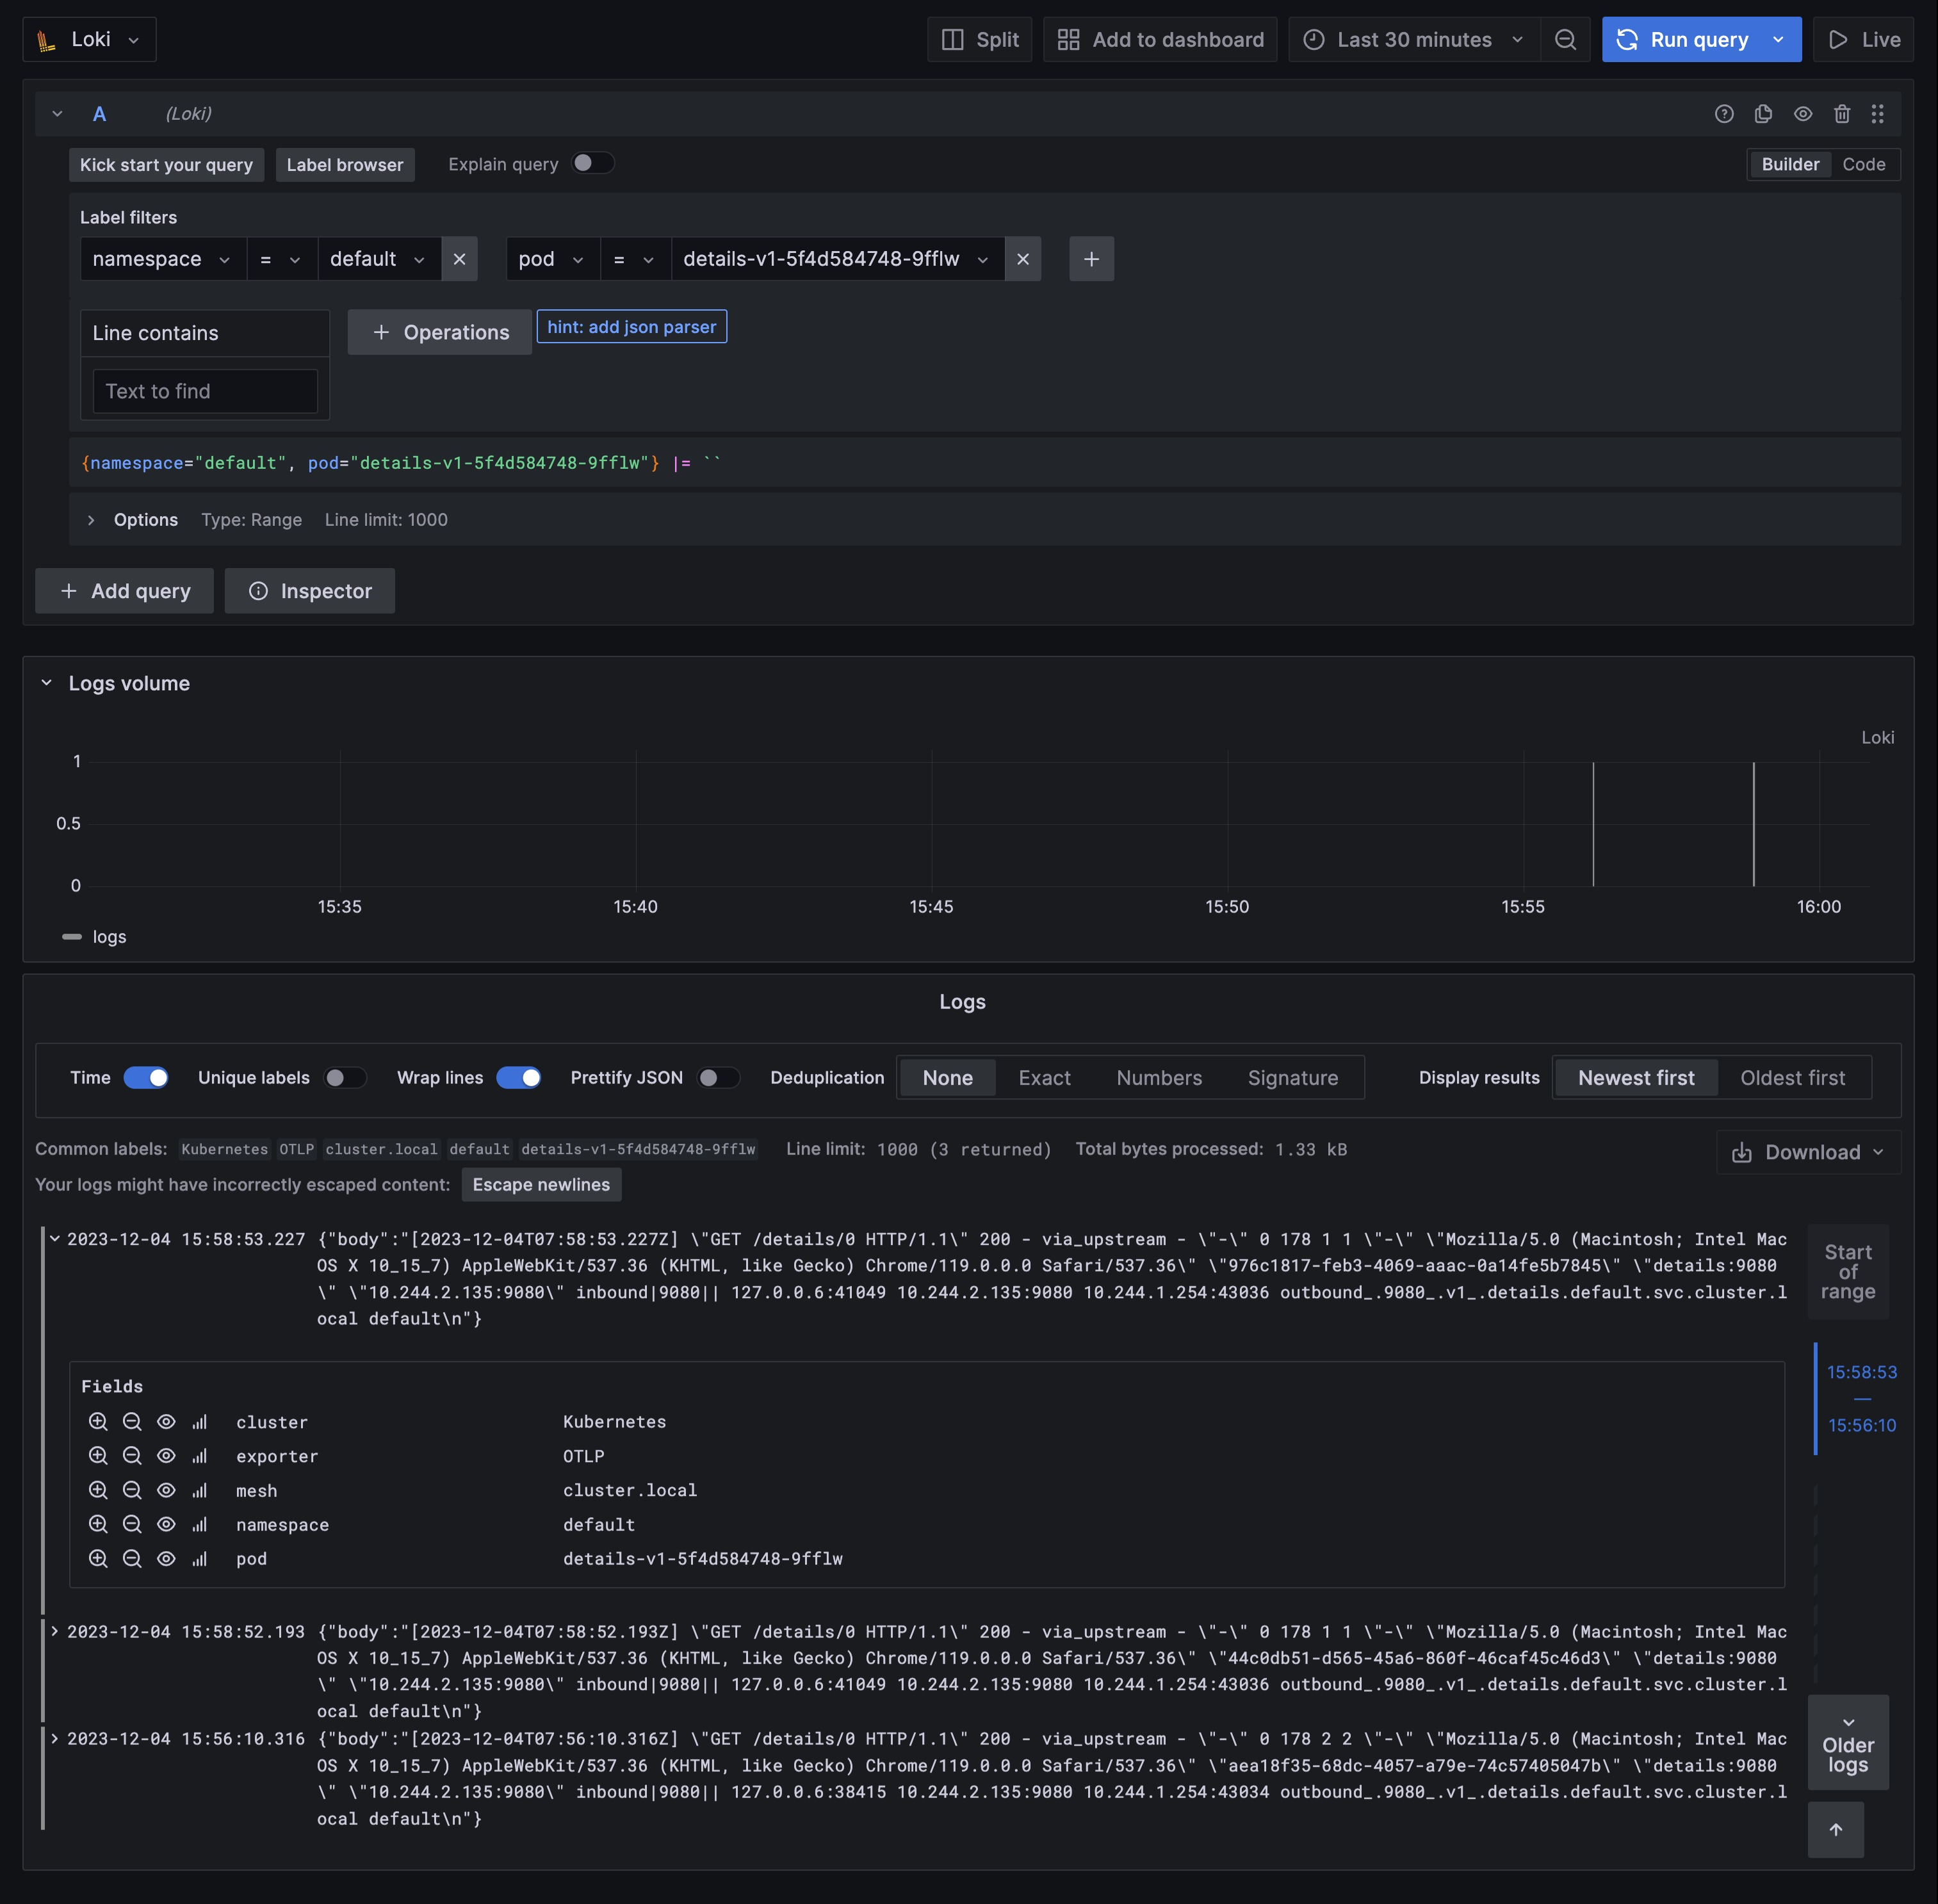
这里我们直接打开 Grafana 的 Loki Dashboard 即可:
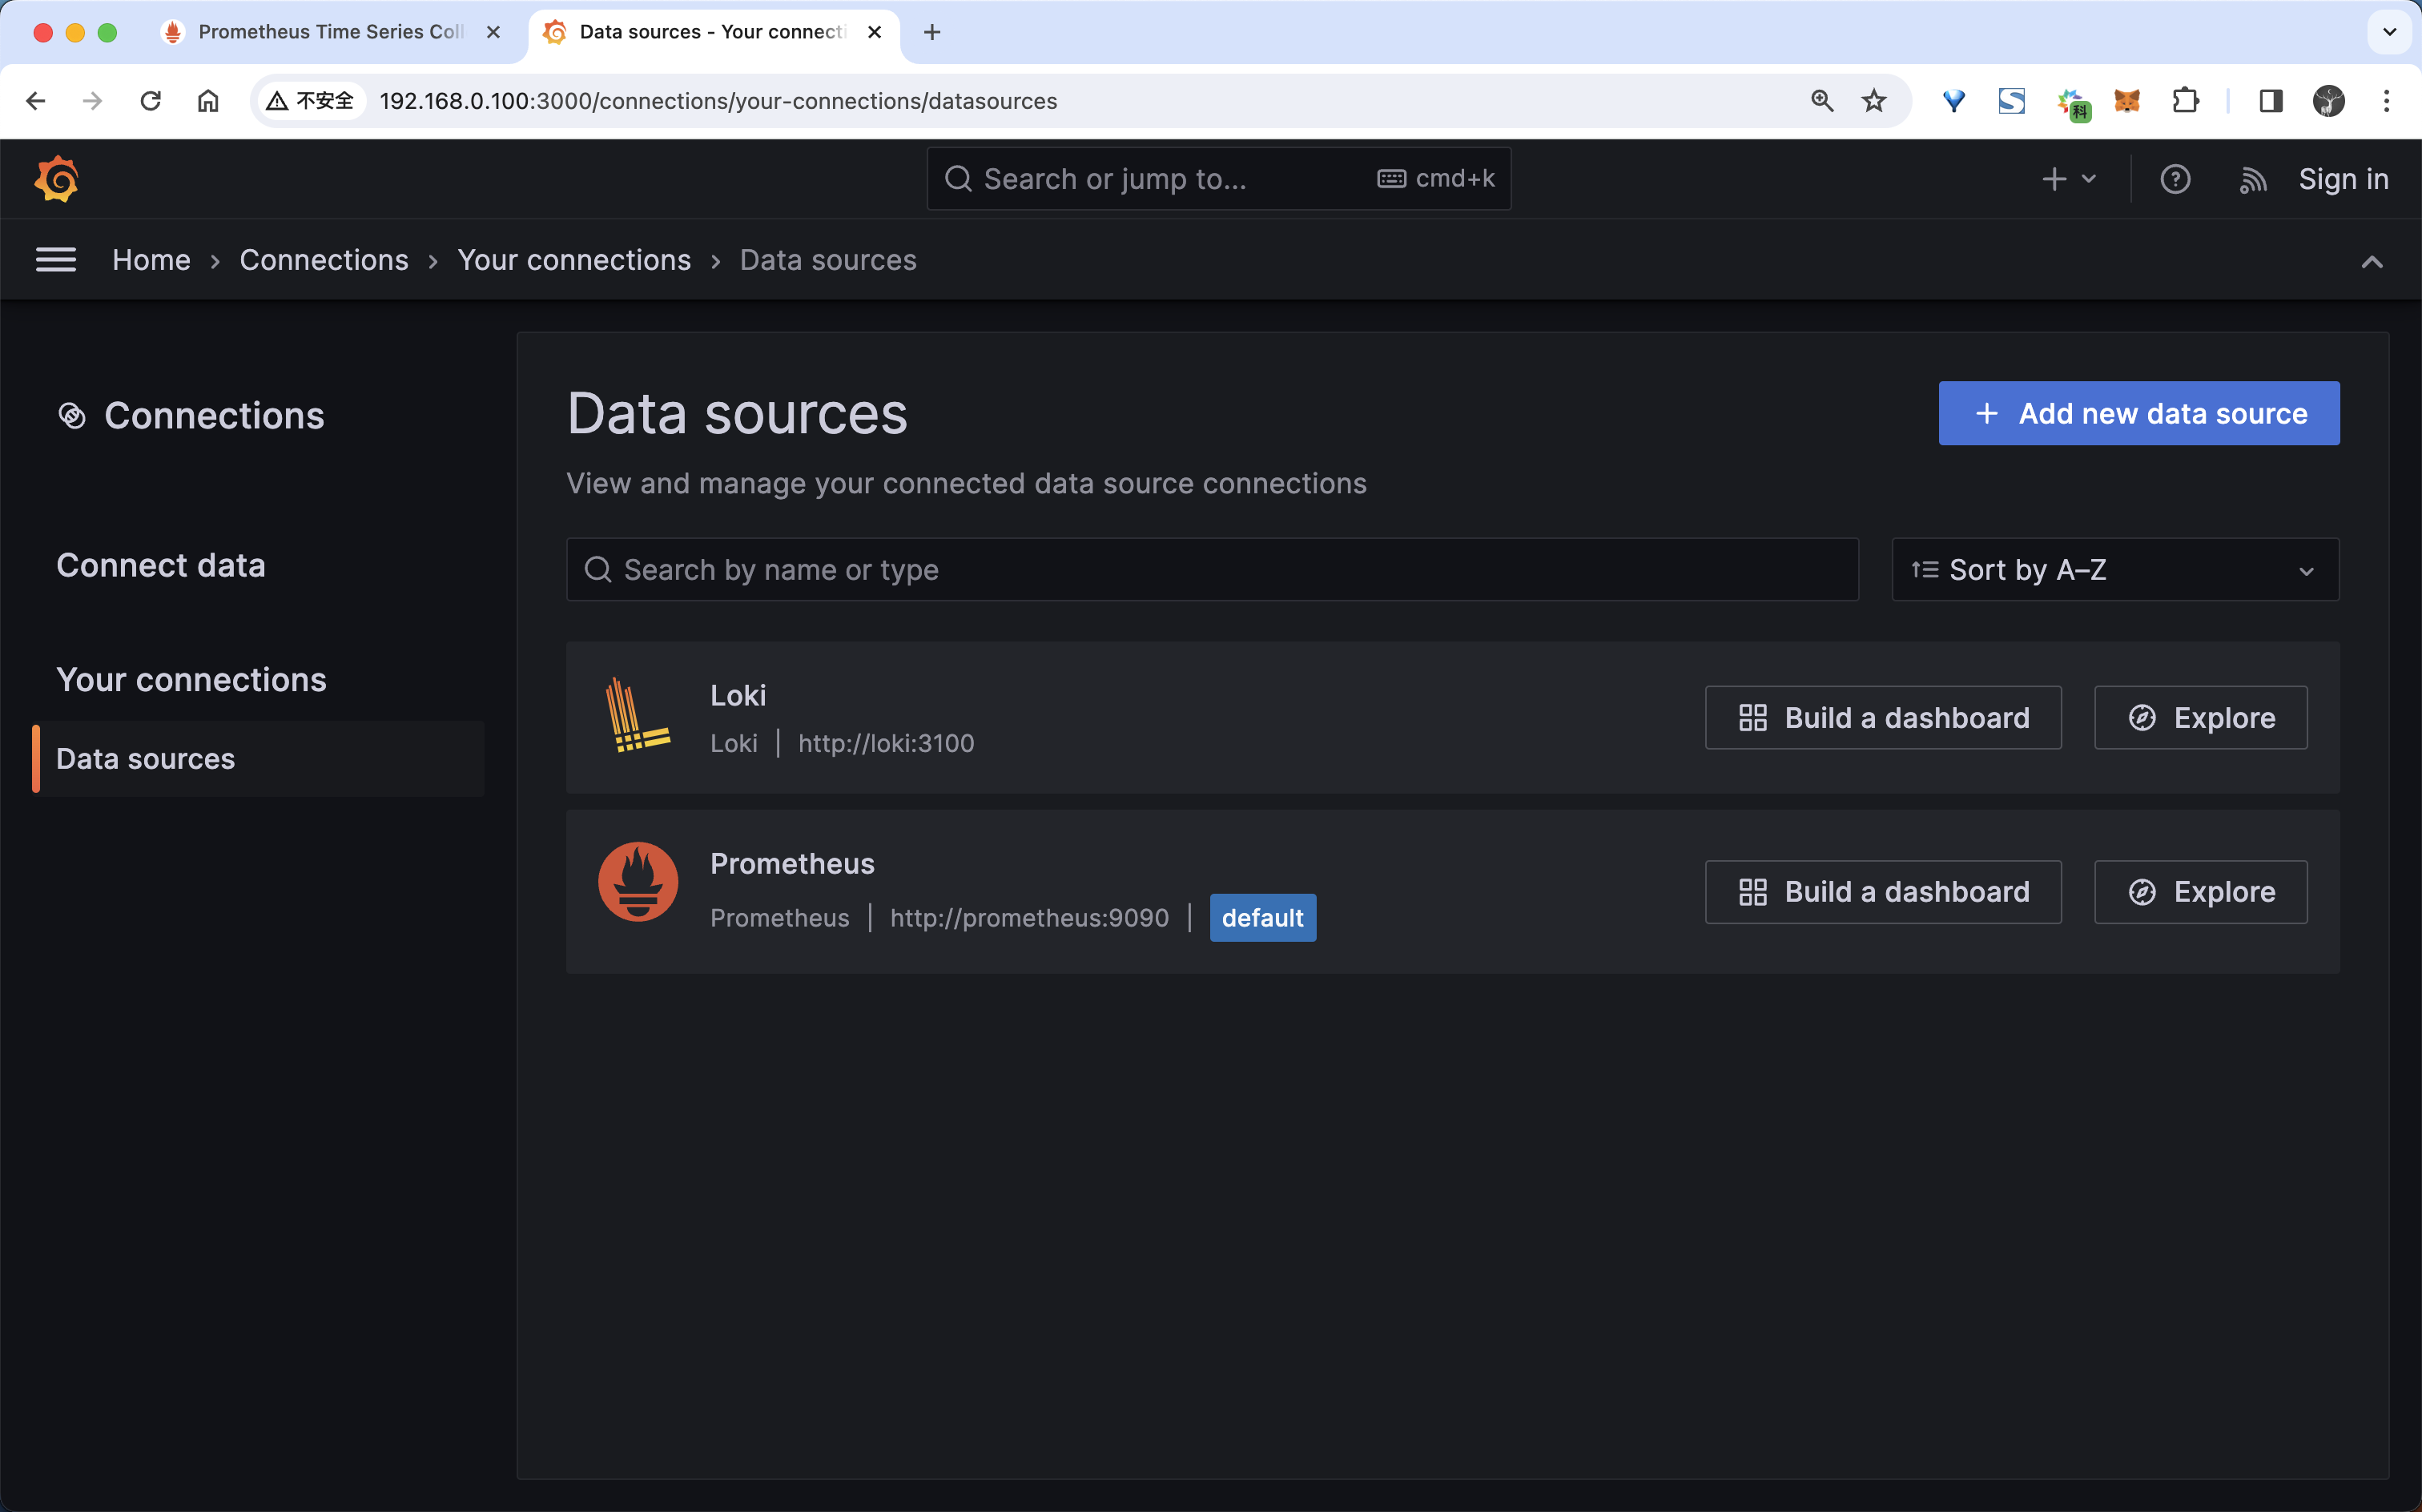
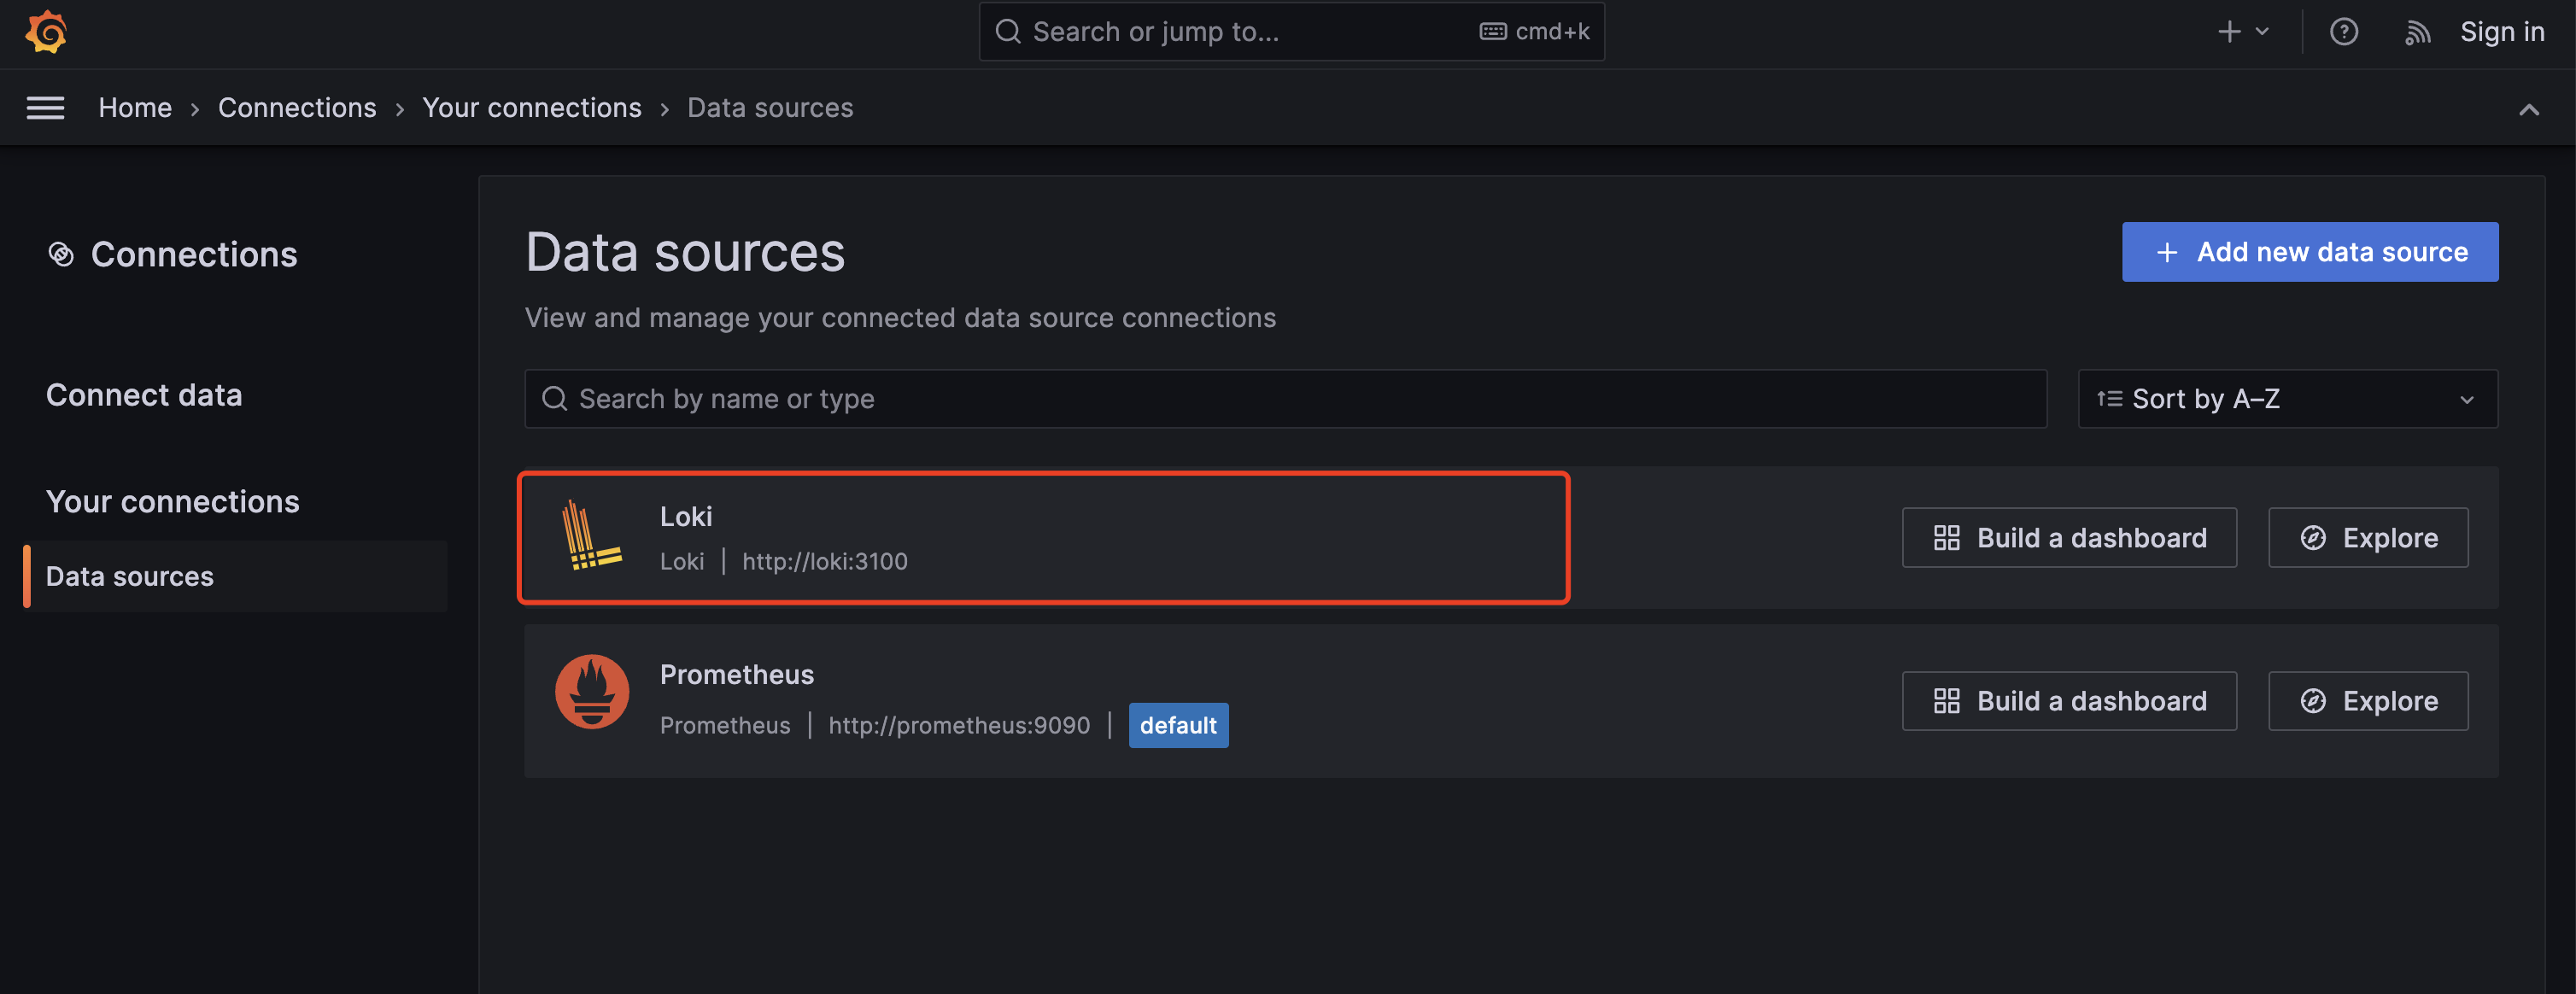
istioctl dashboard grafana首先要在 Grafana 中添加 Loki 数据源:
然后接下来我们去访问 Productpage 应用产生一些日志数据,再切换回到 Grafana 中,切换到 Explore 页面,然后选择 Loki 数据源,就可以看到 Loki 中的日志了:
同样的我们还可以使用 Telemetry API 来做一些更加细粒度的配置。
比如可以使用以下配置禁用 sleep 服务的访问日志:
apiVersion: telemetry.istio.io/v1alpha1
kind: Telemetry
metadata:
  name: disable-sleep-logging
  namespace: default
spec:
  selector:
    matchLabels:
      app: sleep
  accessLogging:
    - providers:
        - name: otel
disabled: true还可以使用 match 字段来指定要过滤的流量,比如可以使用以下配置禁用 httpbin 服务的入站访问日志:
apiVersion: telemetry.istio.io/v1alpha1
kind: Telemetry
metadata:
  name: disable-httpbin-logging
spec:
  selector:
    matchLabels:
      app: httpbin
  accessLogging:
    - providers:
        - name: otel
      match:
        mode: SERVER # 入站模式
disabled: true # 禁用此外我们可以通过 CEL 表达式过滤访问日志。只有响应码大于等于 500 时,才会显示访问日志,如下所示:
apiVersion: telemetry.istio.io/v1alpha1
kind: Telemetry
metadata:
  name: filter-sleep-logging
spec:
  selector:
    matchLabels:
      app: sleep
  accessLogging:
    - providers:
        - name: otel
      filter:
expression: response.code >= 500比如只有响应码大于等于 400 或请求转到 BlackHoleCluster 或 PassthroughCluster 时,才显示访问日志:
apiVersion: telemetry.istio.io/v1alpha1
kind: Telemetry
metadata:
  name: default-exception-logging
  namespace: istio-system
spec:
  accessLogging:
    - providers:
        - name: otel
      filter:
expression: "response.code >= 400 || xds.cluster_name == 'BlackHoleCluster' || xds.cluster_name == 'PassthroughCluster' "关于赋值表达式的使用和前面指标中的使用方式一致,这里就不再赘述了。
关于我
我的博客主旨:
- 排版美观,语言精炼;
- 文档即手册,步骤明细,拒绝埋坑,提供源码;
- 本人实战文档都是亲测成功的,各位小伙伴在实际操作过程中如有什么疑问,可随时联系本人帮您解决问题,让我们一起进步!
🍀 微信二维码 x2675263825 (舍得), qq:2675263825。

🍀 微信公众号 《云原生架构师实战》

🍀 个人博客站点

🍀 语雀
https://www.yuque.com/xyy-onlyone
🍀 csdn
https://blog.csdn.net/weixin_39246554?spm=1010.2135.3001.5421

🍀 知乎
https://www.zhihu.com/people/foryouone

最后
好了,关于本次就到这里了,感谢大家阅读,最后祝大家生活快乐,每天都过的有意义哦,我们下期见!