
快捷菜单
常用功能一站直达
更多功能请点顶栏「快捷菜单」


1有k8s环境;
2已经把prometheus应用部署到k8s环境里;关于如何将prometheus应用部署到k8s环境里,请查看我的另一篇文章,获取完整的部署方法!。
《实战-prometheus部署到k8s-2022.4.29(测试成功)》https://onedayxyy.cn/topic/fhkgp

🍀 实验环境
1k8s:v1.22.2(1 master,2 node)
2containerd: v1.5.5
3prometneus: docker.io/prom/prometheus:v2.34.0
🍀 实验软件
直接拷贝文档代码即可!
链接:https://pan.baidu.com/s/1GdxitBmmH6JaTmcg8kFn2w?pwd=au4n
提取码:au4n
2022.4.30-prometheus监控k8s集群node资源-code

node-exporter 的时候有一些细节需要注意,如下资源清单文件:[root@master1 prometheus-example]#pwd
/root/prometheus-example
[root@master1 prometheus-example]#vim prometheus-node-exporter.yaml
 1# prometheus-node-exporter.yaml
 2apiVersion: apps/v1
 3kind: DaemonSet
 4metadata:
 5  name: node-exporter
 6  namespace: monitor
 7  labels:
 8    app: node-exporter
 9spec:
10  selector:
11    matchLabels:
12      app: node-exporter
13  template:
14    metadata:
15      labels:
16        app: node-exporter
17    spec:
18      hostPID: true
19      hostIPC: true
20      hostNetwork: true   #因为这里用的是hostNetwortk模式,所以后面就不需要创建svc了!!!
21      nodeSelector:
22        kubernetes.io/os: linux
23      containers:
24      - name: node-exporter
25        image: prom/node-exporter:v1.3.1
26        args:
27        - --web.listen-address=$(HOSTIP):9100
28        - --path.procfs=/host/proc
29        - --path.sysfs=/host/sys
30        - --path.rootfs=/host/root
31        - --no-collector.hwmon # 禁用不需要的一些采集器
32        - --no-collector.nfs
33        - --no-collector.nfsd
34        - --no-collector.nvme
35        - --no-collector.dmi
36        - --no-collector.arp
37        - --collector.filesystem.ignored-mount-points=^/(dev|proc|sys|var/lib/containerd/.+|/var/lib/docker/.+|var/lib/kubelet/pods/.+)($|/)
38        - --collector.filesystem.ignored-fs-types=^(autofs|binfmt_misc|cgroup|configfs|debugfs|devpts|devtmpfs|fusectl|hugetlbfs|mqueue|overlay|proc|procfs|pstore|rpc_pipefs|securityfs|sysfs|tracefs)$
39        ports:
40        - containerPort: 9100
41        env:
42        - name: HOSTIP
43          valueFrom:
44            fieldRef:
45              fieldPath: status.hostIP #Downward API
46        resources:
47          requests:
48            cpu: 150m
49            memory: 180Mi
50          limits:
51            cpu: 150m
52            memory: 180Mi
53        securityContext:
54          runAsNonRoot: true
55          runAsUser: 65534
56        volumeMounts:
57        - name: proc
58          mountPath: /host/proc
59        - name: sys
60          mountPath: /host/sys
61        - name: root
62          mountPath: /host/root
63          mountPropagation: HostToContainer #这个是what??
64          readOnly: true
65      tolerations:
66      - operator: "Exists"
67      volumes:
68      - name: proc
69        hostPath:
70          path: /proc
71      - name: dev
72        hostPath:
73          path: /dev
74      - name: sys
75        hostPath:
76          path: /sys
77      - name: root
78        hostPath:
79          path: /
注意:这里是可以更改监听端口的。
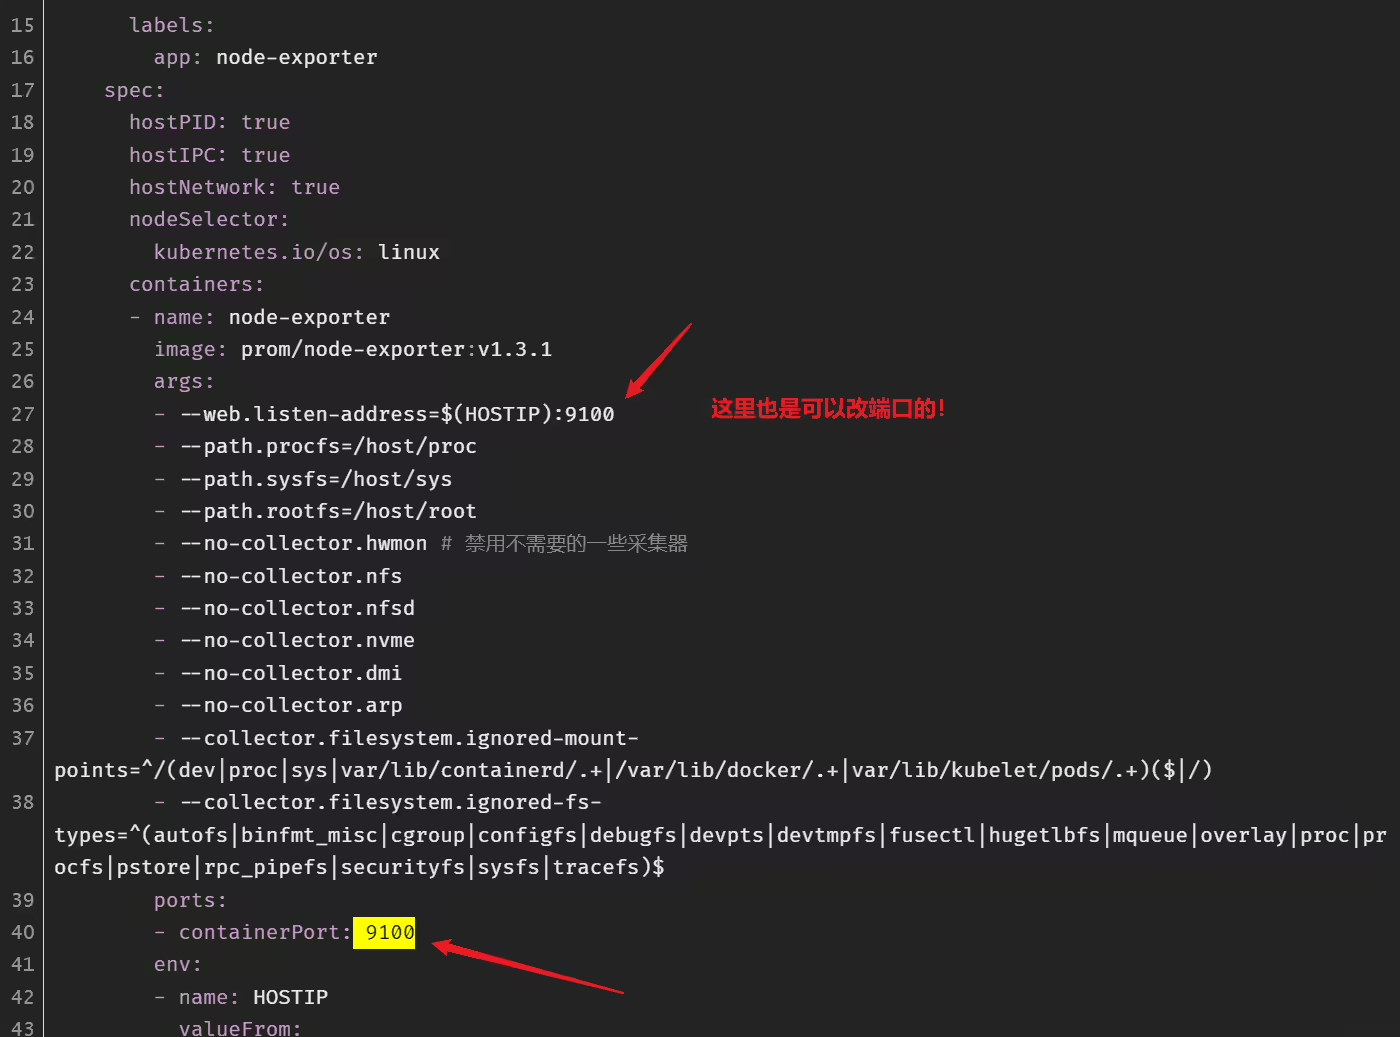
注意:
(1)由于我们要获取到的数据是主机的监控指标数据,而我们的 node-exporter 是运行在容器中的,所以我们在 Pod 中需要配置一些 Pod 的安全策略,这里我们就添加了 hostPID: true、hostIPC: true、hostNetwork: true 3个策略,用来使用主机的 PID namespace、IPC namespace 以及主机网络,这些 namespace 就是用于容器隔离的关键技术,要注意这里的 namespace 和集群中的 namespace 是两个完全不相同的概念。
(2)另外我们还将主机的 /dev、/proc、/sys这些目录挂载到容器中,这些因为我们采集的很多节点数据都是通过这些文件夹下面的文件来获取到的,比如我们在使用 top 命令可以查看当前 cpu 使用情况,数据就来源于文件 /proc/stat。使用 free 命令可以查看当前内存使用情况,其数据来源是来自 /proc/meminfo 文件。
(3)另外由于我们集群使用的是 kubeadm 搭建的,所以如果希望 master 节点也一起被监控,则需要添加相应的容忍。
🍀 部署资源
1[root@master1 prometheus-example]#kubectl apply -f prometheus-node-exporter.yaml
2daemonset.apps/node-exporter created
3
4[root@master1 prometheus-example]#kubectl get pods -nmonitor -l app=node-exporter -o wide
5NAME                  READY   STATUS    RESTARTS   AGE   IP            NODE      NOMINATED NODE   READINESS GATES
6node-exporter-6z7dx   1/1     Running   0          39s   172.29.9.52   node1     <none>           <none>
7node-exporter-bbsh6   1/1     Running   0          39s   172.29.9.51   master1   <none>           <none>
8node-exporter-lm46b   1/1     Running   0          39s   172.29.9.53   node2     <none>           <none>
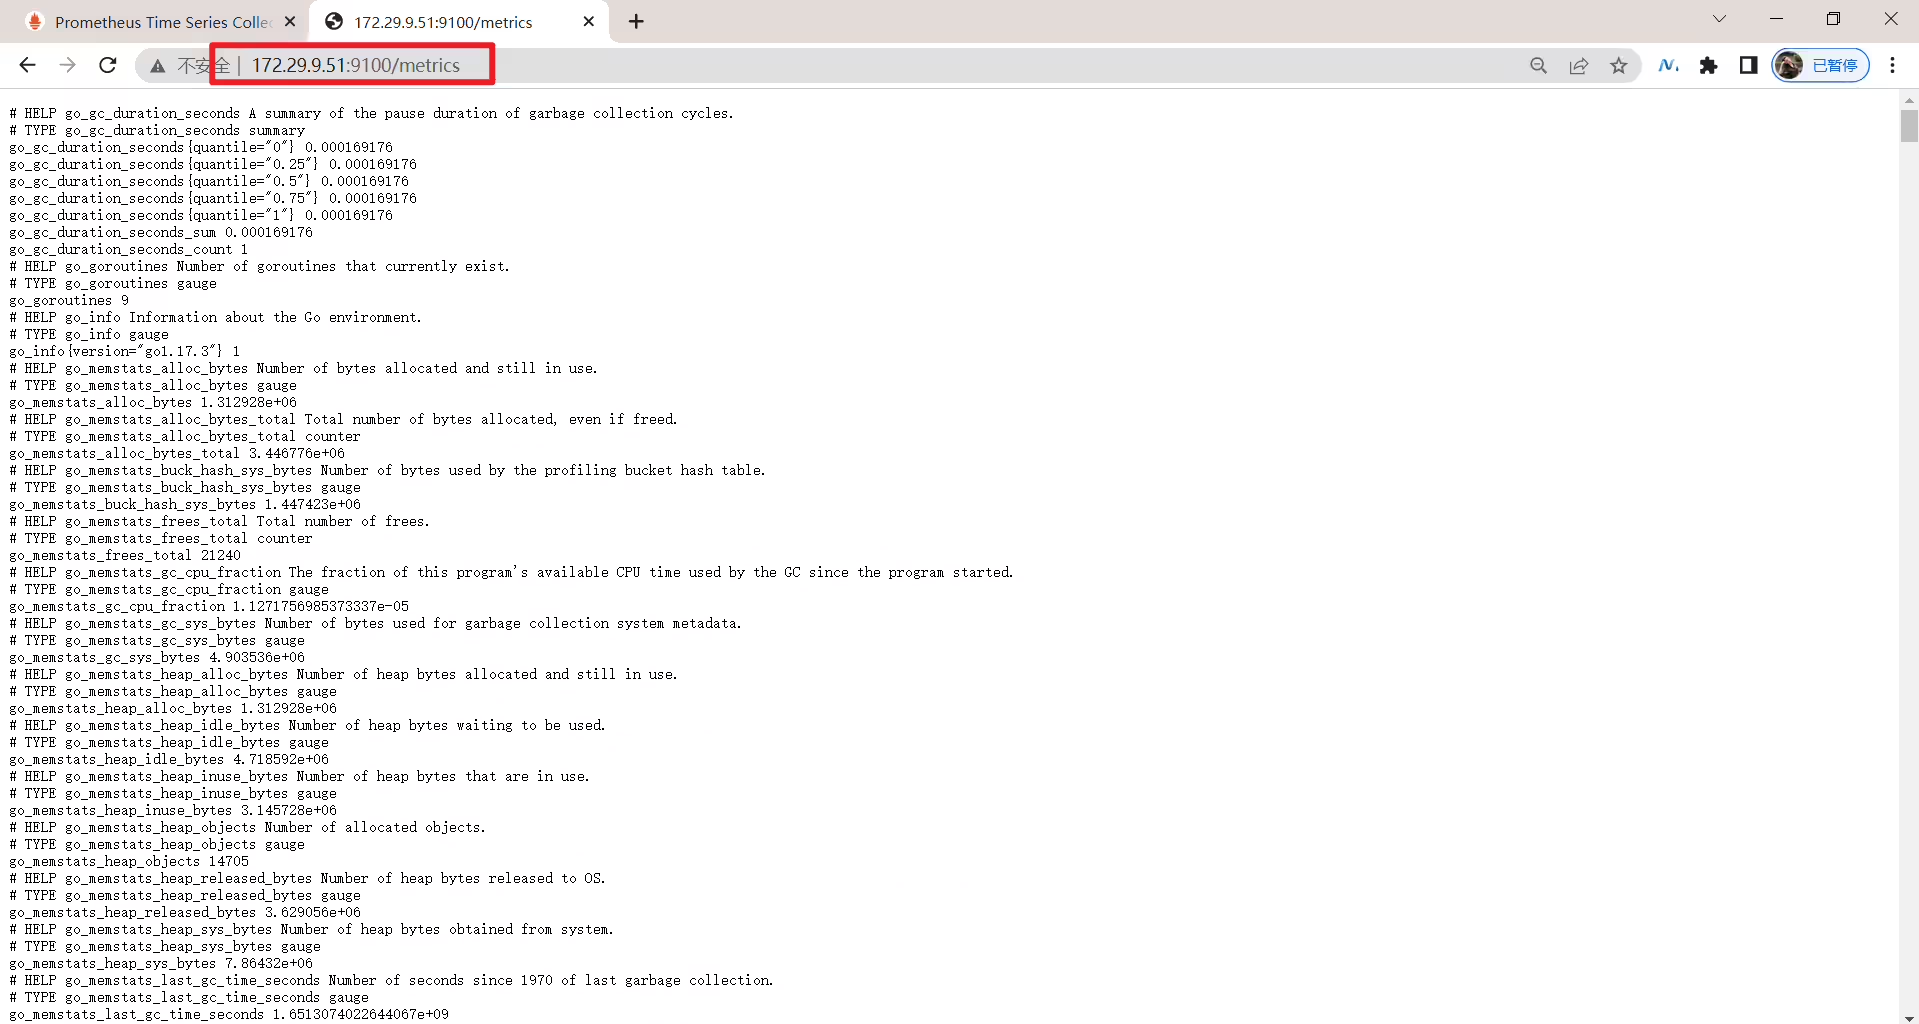
部署完成后,我们可以看到在几个节点上都运行了一个 Pod,由于我们指定了 hostNetwork=true,所以在每个节点上就会绑定一个端口 9100。
1➜ curl 172.29.9.51:9100/metrics
2#curl 192.168.1.25:9100/metrics
3...
4node_filesystem_device_error{device="shm",fstype="tmpfs",mountpoint="/rootfs/var/lib/docker/containers/aefe8b1b63c3aa5f27766053ec817415faf8f6f417bb210d266fef0c2da64674/shm"} 1
5node_filesystem_device_error{device="shm",fstype="tmpfs",mountpoint="/rootfs/var/lib/docker/containers/c8652ca72230496038a07e4fe4ee47046abb5f88d9d2440f0c8a923d5f3e133c/shm"} 1
6node_filesystem_device_error{device="tmpfs",fstype="tmpfs",mountpoint="/dev"} 0
7node_filesystem_device_error{device="tmpfs",fstype="tmpfs",mountpoint="/dev/shm"} 0
8...
🍀 扩展:
当然如果你觉得上面的手动安装方式比较麻烦,我们也可以使用 Helm 的方式来安装:
1helm upgrade --install node-exporter --namespace monitor stable/prometheus-node-exporter由于我们这里每个节点上面都运行了 node-exporter 程序,如果我们通过一个 Service 来将数据收集到一起用静态配置的方式配置到 Prometheus 去中,就只会显示一条数据,我们得自己在指标数据中去过滤每个节点的数据。
当然我们也可以手动的把所有节点用静态的方式配置到 Prometheus 中去,但是以后要新增或者去掉节点的时候就还得手动去配置。
那么有没有一种方式可以让 Prometheus 去自动发现我们节点的 node-exporter 程序,并且按节点进行分组呢?这就是 Prometheus 里面非常重要的服务发现功能了。
在 Kubernetes 下,Promethues 通过与 Kubernetes API 集成,主要支持5种服务发现模式,分别是:Node、Service、Pod、Endpoints、Ingress。
我们通过 kubectl 命令可以很方便的获取到当前集群中的所有节点信息:
1[root@master1 prometheus-example]# kubectl get node
2NAME      STATUS   ROLES                  AGE    VERSION
3master1   Ready    control-plane,master   181d   v1.22.2
4node1     Ready    <none>                 181d   v1.22.2
5node2 Ready <none> 181d v1.22.2prometheus.yml 文件中配置如下的 job 任务即可:[root@master1 prometheus-example]#pwd
/root/prometheus-example
[root@master1 prometheus-example]#vim prometheus-cm.yaml
 1# prometheus-cm.yaml
 2apiVersion: v1
 3kind: ConfigMap
 4metadata:
 5  name: prometheus-config
 6  namespace: monitor
 7data:
 8  prometheus.yml: |
 9    global:
10      scrape_interval: 15s
11      scrape_timeout: 15s
12
13    scrape_configs:
14    - job_name: 'prometheus'
15      static_configs:
16        - targets: ['localhost:9090']
17
18    - job_name: 'nodes'
19      kubernetes_sd_configs:
20        - role: node
通过指定 kubernetes_sd_configs 的模式为 node,Prometheus 就会自动从 Kubernetes 中发现所有的 node 节点并作为当前 job 监控的目标实例,发现的节点 /metrics 接口是默认的 kubelet 的 HTTP 接口。
🍀 部署prometheus配置文件
1[root@master1 prometheus-example]#kubectl apply -f prometheus-cm.yaml
2configmap/prometheus-config configured
3
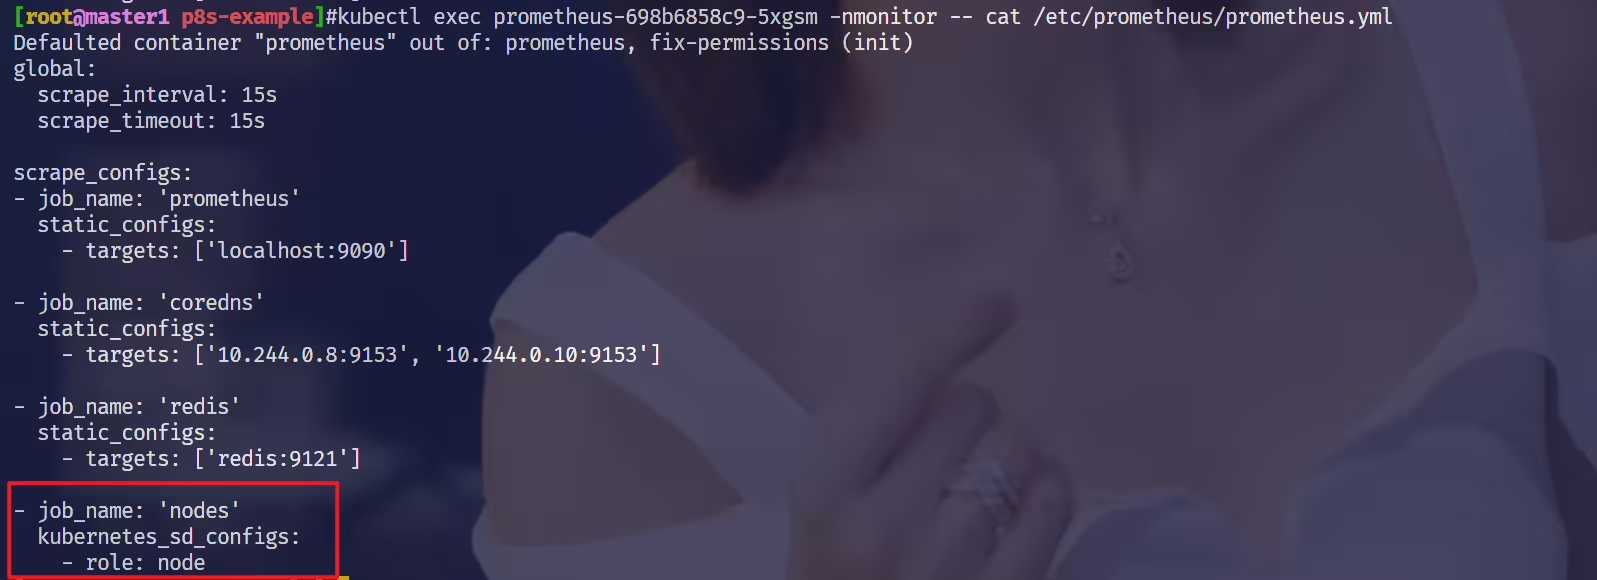
4[root@master1 prometheus-example]#kubectl exec prometheus-698b6858c9-5xgsm -nmonitor -- cat /etc/prometheus/prometheus.yml
可以看到prometheus pod的配置文件已经被更新了:
1[root@master1 prometheus-example]# curl -X POST "http://172.29.9.51:32700/-/reload"
2
3#curl -X POST "http://192.168.1.25:32700/-/reload"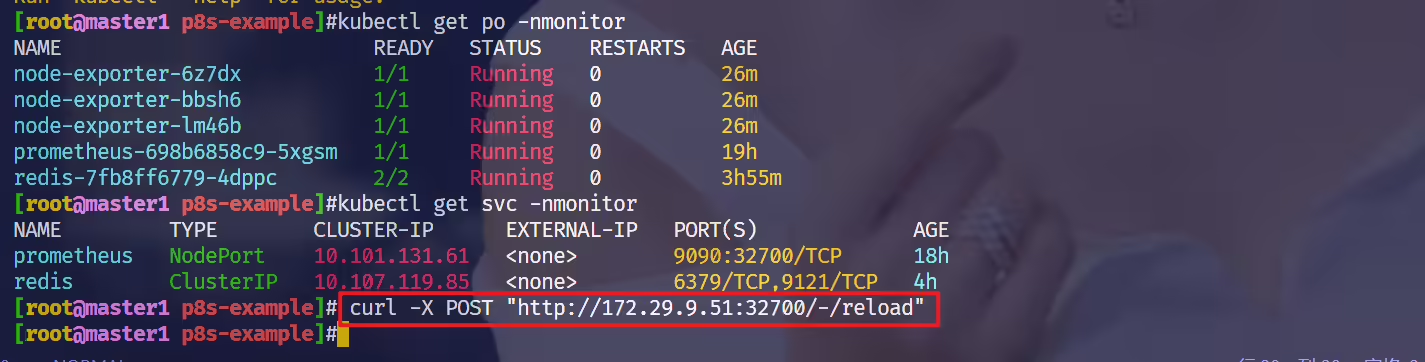
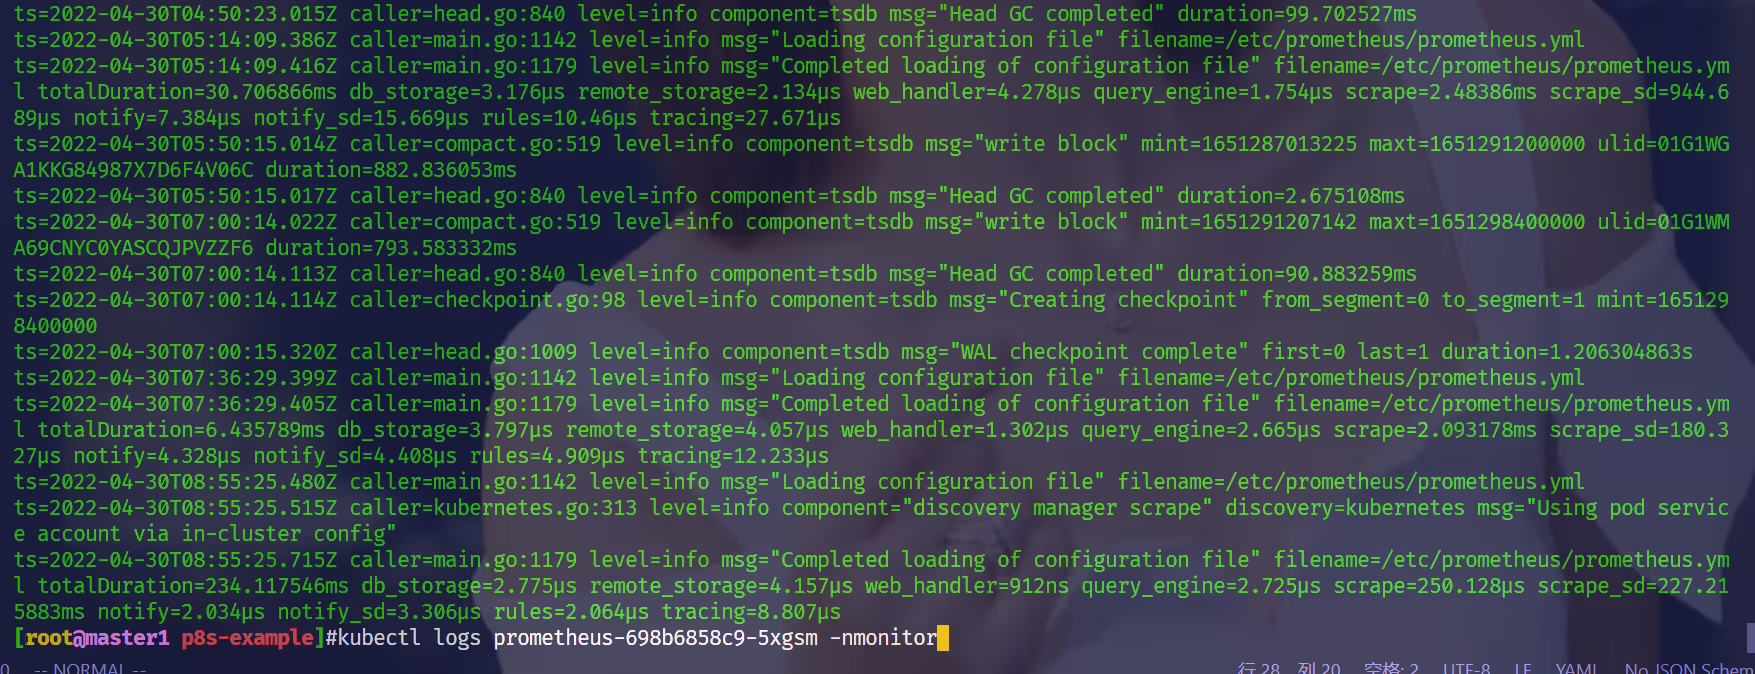
看了下prometheus pod日志没什么报错:
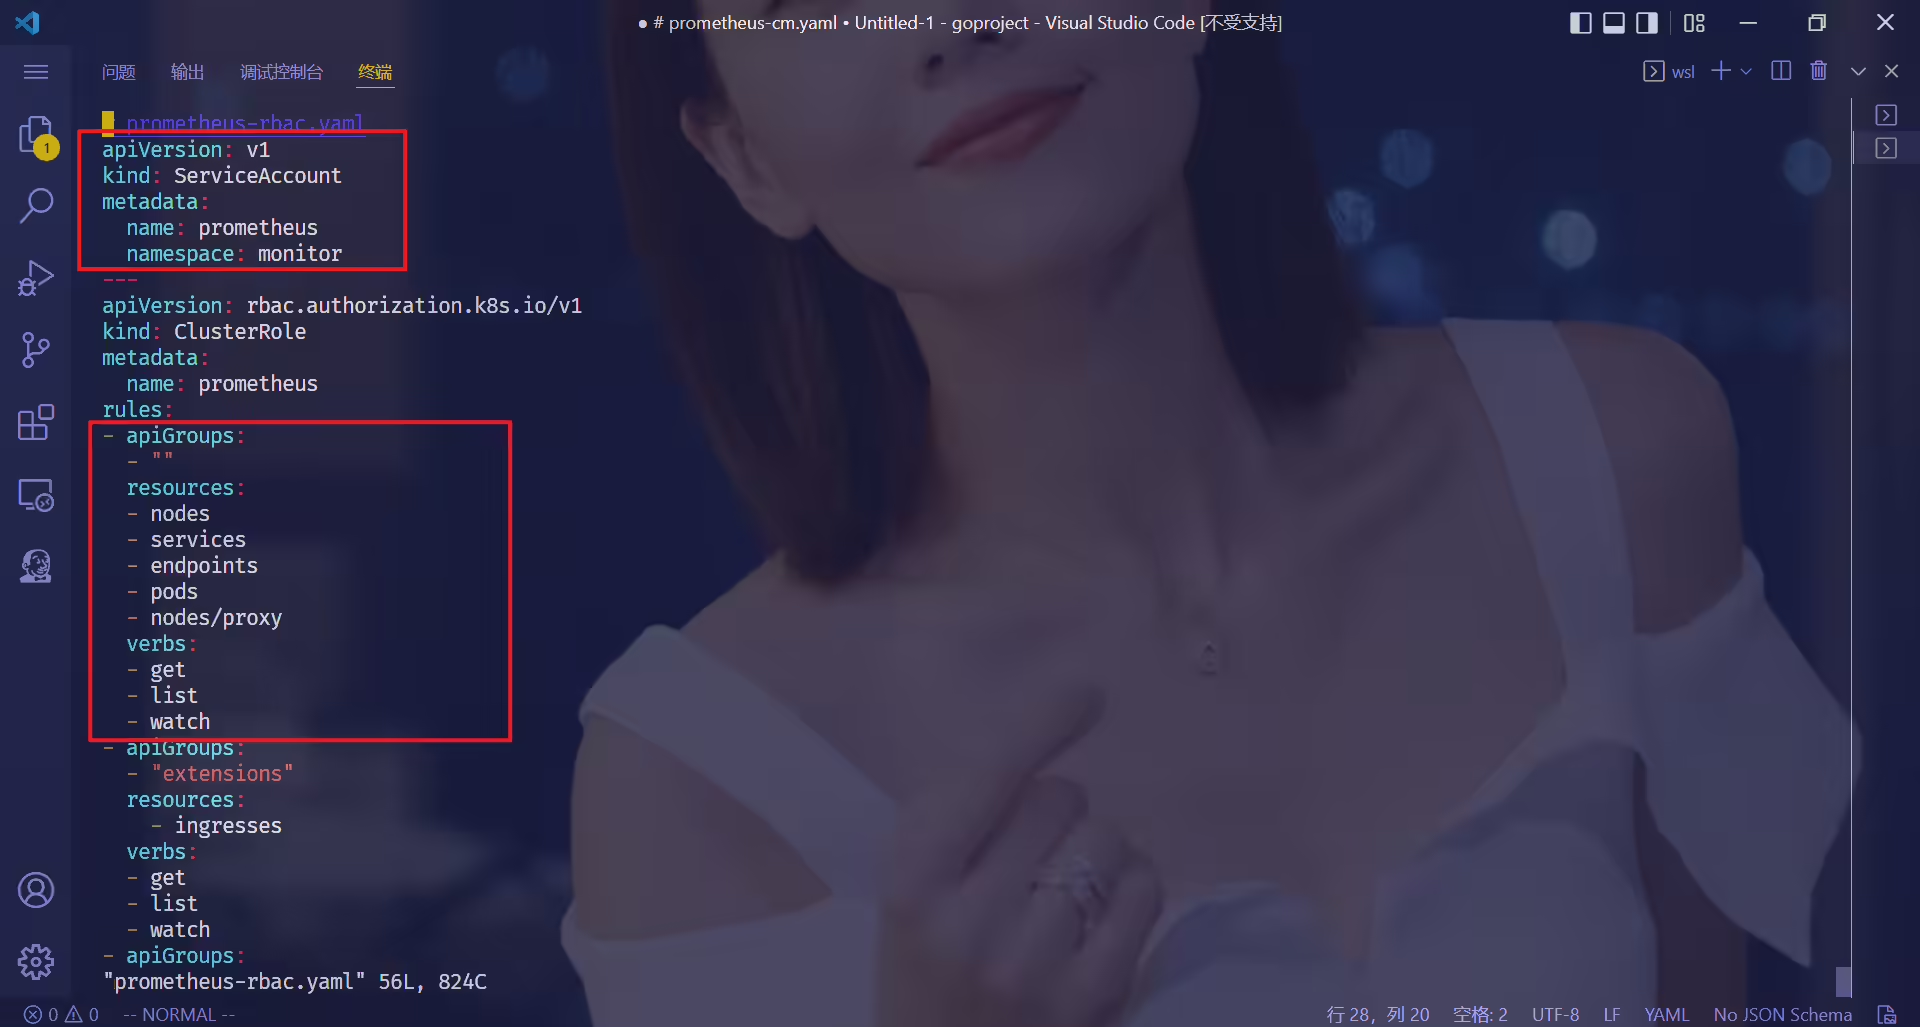
[root@master1 prometheus-example]#vim prometheus-rbac.yaml
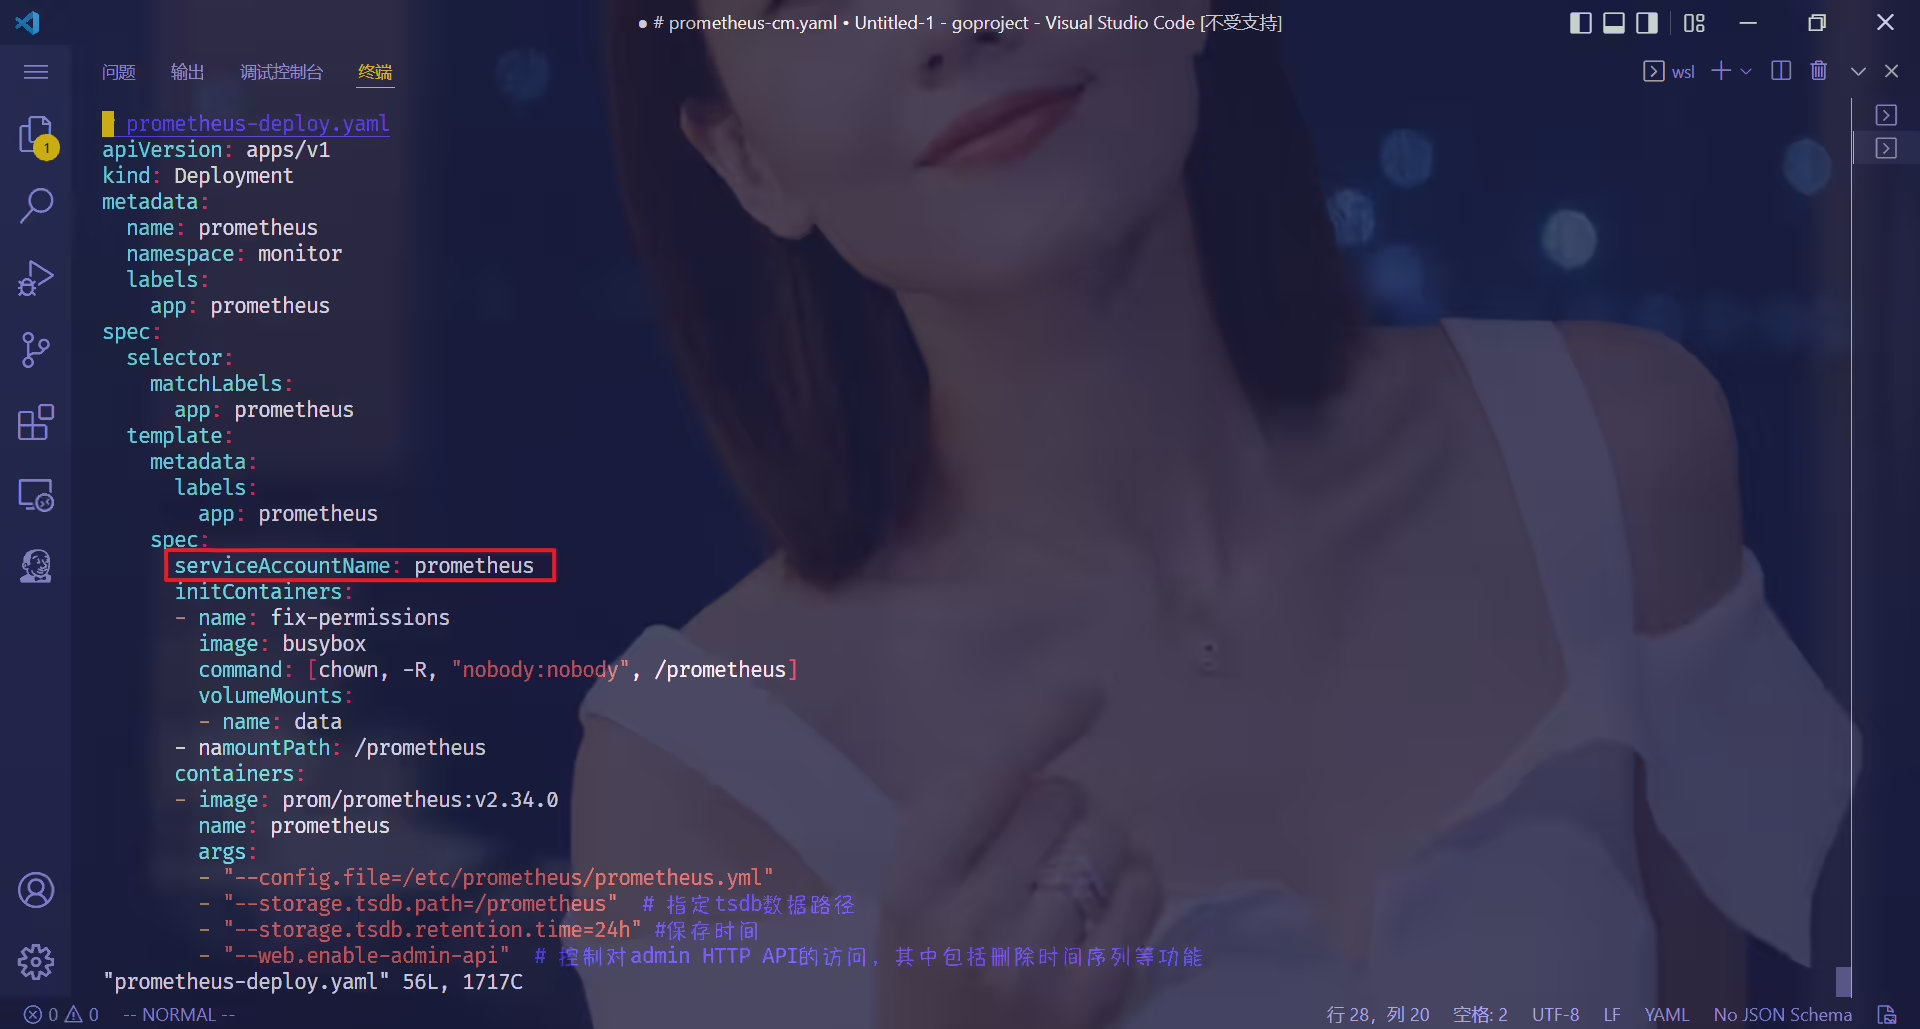
http://任意节点IP:32700: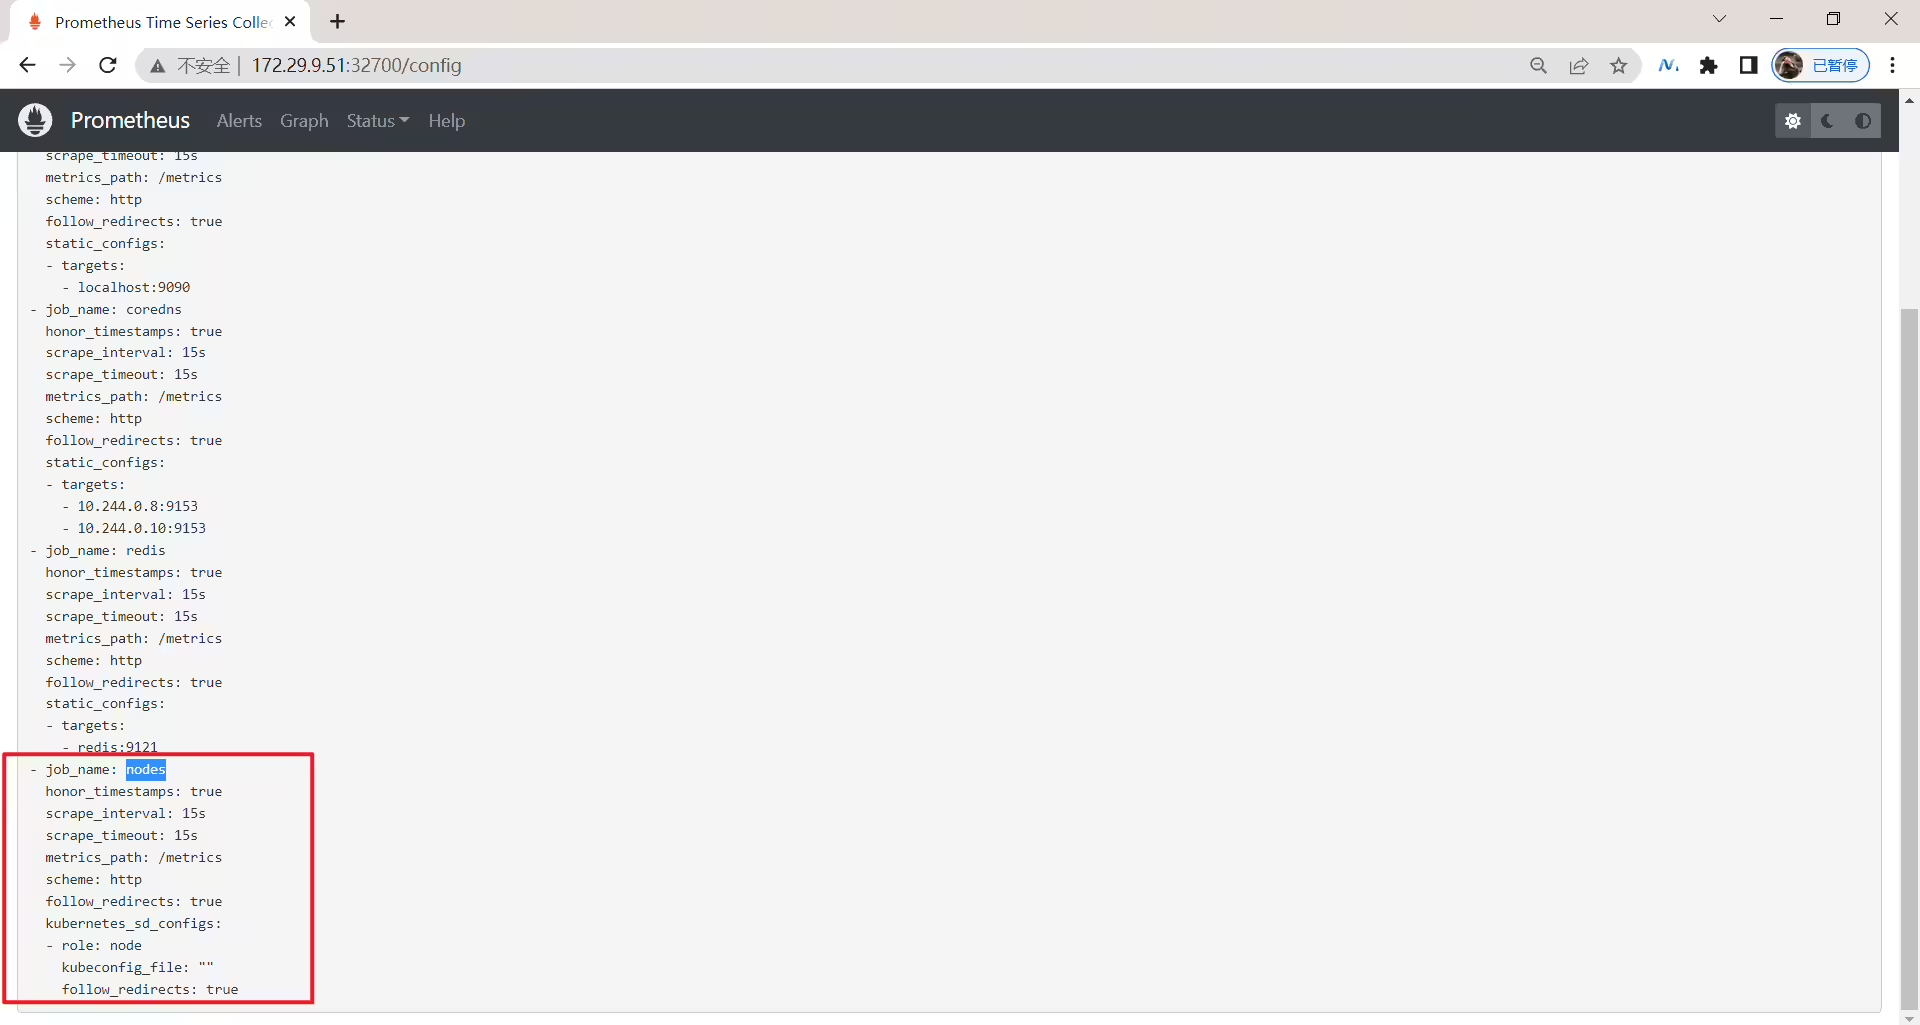

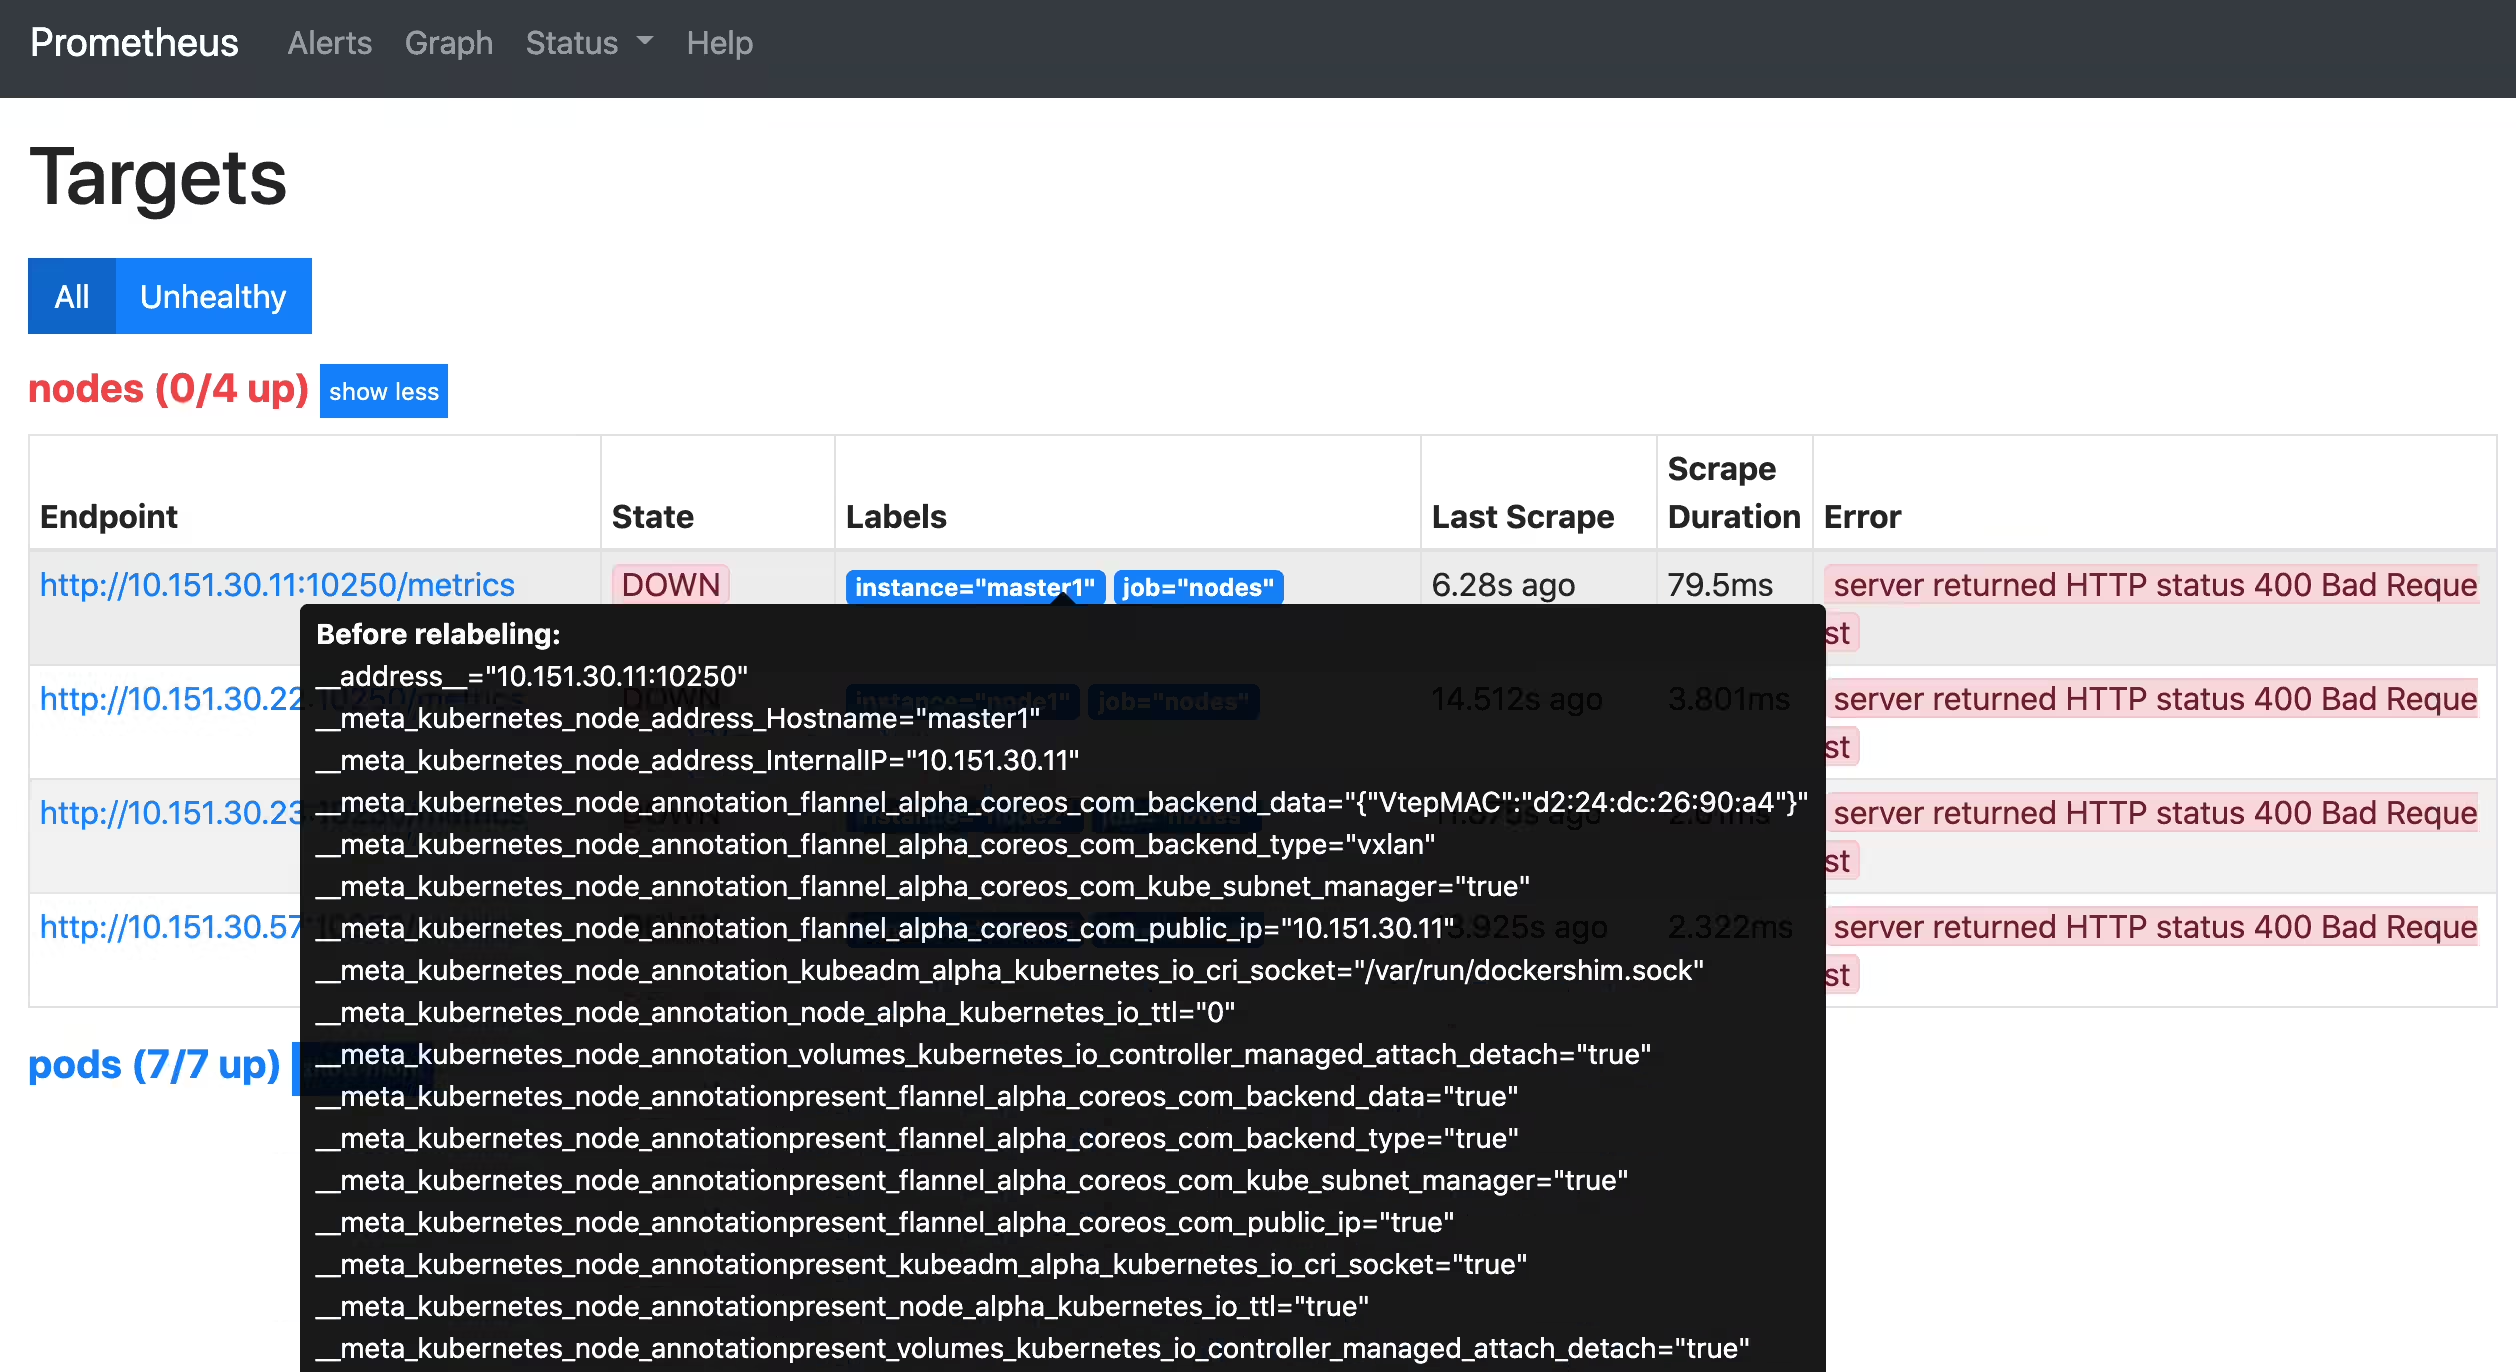
nodes 这个 job 任务已经自动发现了我们3个 node 节点,但是在获取数据的时候失败了,出现了类似于下面的错误信息:1server returned HTTP status 400 Bad Request这个是因为 prometheus 去发现 Node 模式的服务的时候,访问的端口默认是 10250,而默认是需要认证的 https 协议才有权访问的,但实际上我们并不是希望让去访问10250端口的 /metrics 接口,而是 node-exporter 绑定到节点的 9100 端口,所以我们应该将这里的 10250 替换成 9100,但是应该怎样替换呢?
relabel_configs 中的 replace 能力这里我们就需要使用到 Prometheus 提供的 relabel_configs 中的 replace 能力了,relabel 可以在 Prometheus 采集数据之前,通过 Target 实例的 Metadata 信息,动态重新写入 Label 的值。
除此之外,我们还能根据 Target 实例的 Metadata 信息选择是否采集或者忽略该 Target 实例。
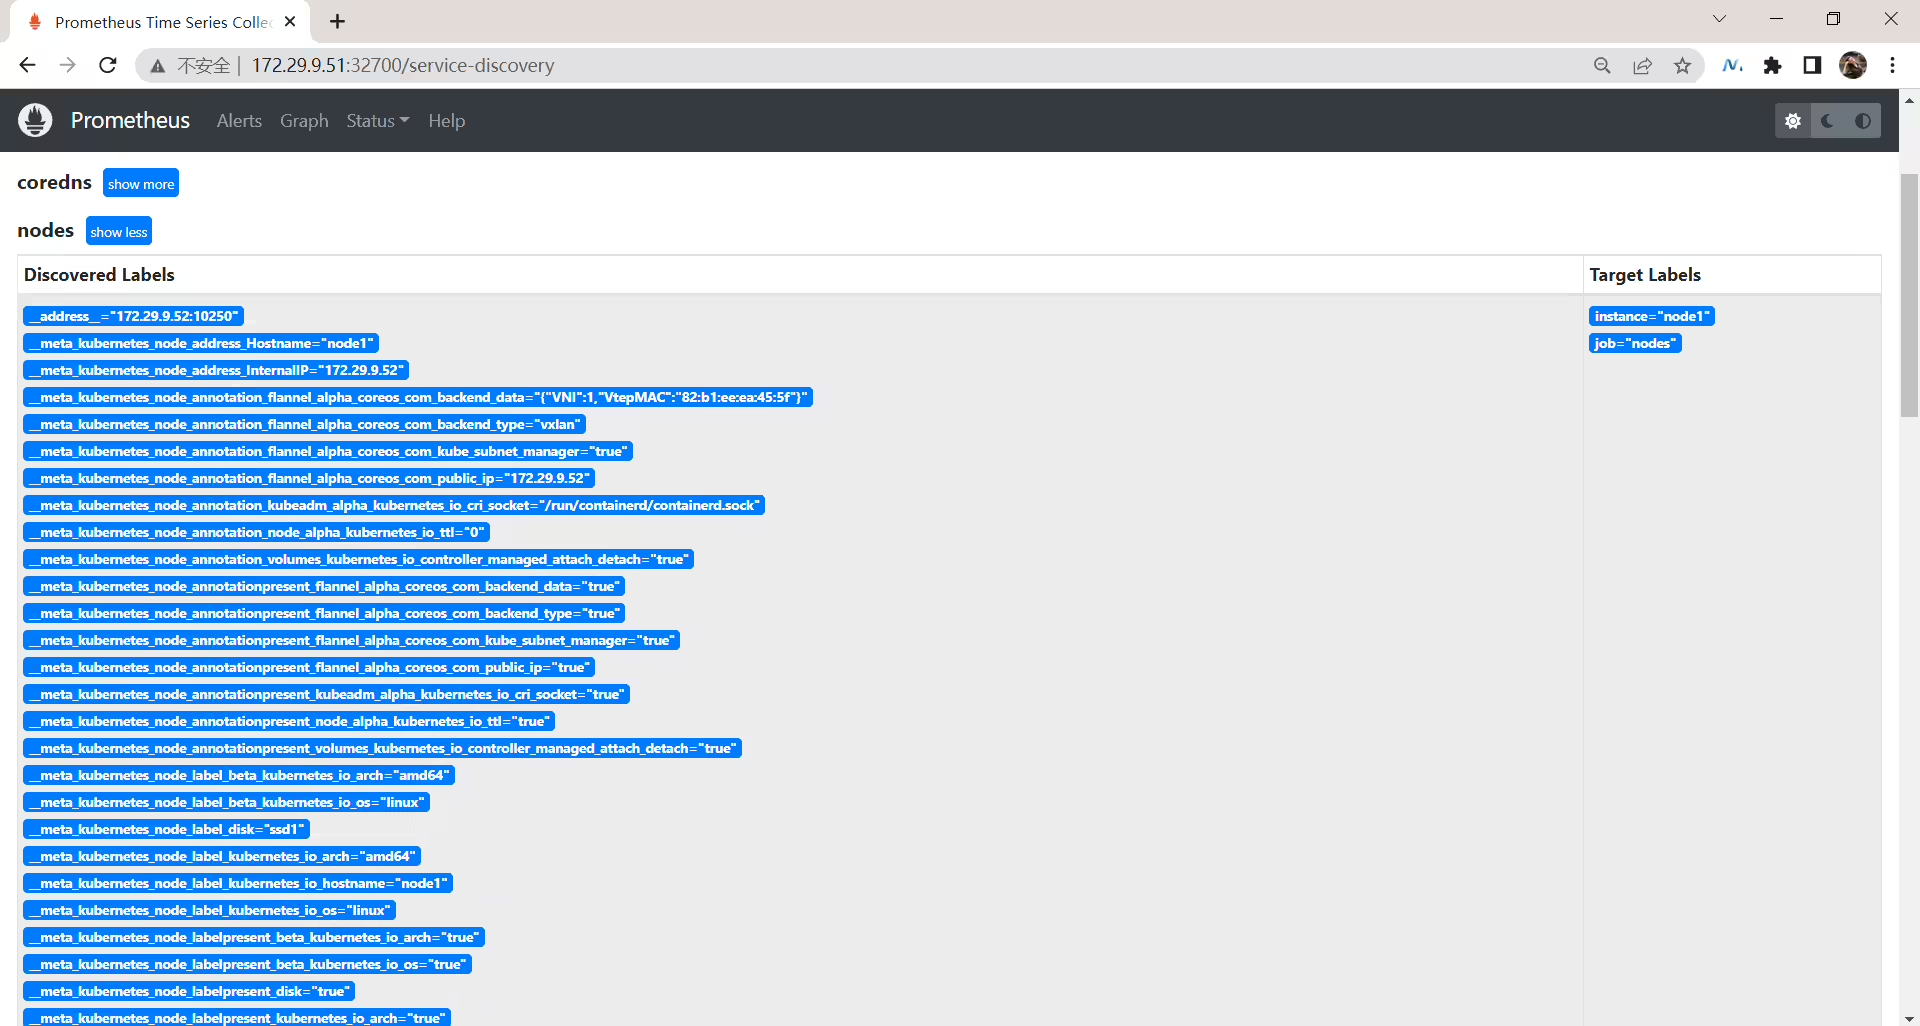
比如我们这里就可以去匹配 __address__ 这个 Label 标签,然后替换掉其中的端口,如果你不知道有哪些 Label 标签可以操作的话,可以在 Service Discovery 页面获取到相关的元标签,这些标签都是我们可以进行 Relabel 的标签:
[root@master1 prometheus-example]#pwd
/root/prometheus-example
[root@master1 prometheus-example]#vim prometheus-cm.yaml
 1# prometheus-cm.yaml
 2apiVersion: v1
 3kind: ConfigMap
 4metadata:
 5  name: prometheus-config
 6  namespace: monitor
 7data:
 8  prometheus.yml: |
 9    global:
10      scrape_interval: 15s
11      scrape_timeout: 15s
12
13    scrape_configs:
14    - job_name: 'prometheus'
15      static_configs:
16        - targets: ['localhost:9090']
17
18
19    - job_name: 'nodes'
20      kubernetes_sd_configs:
21      - role: node
22      relabel_configs:
23      - source_labels: [__address__]
24        regex: '(.*):10250'
25        replacement: '${1}:9100'
26        target_label: __address__
27        action: replace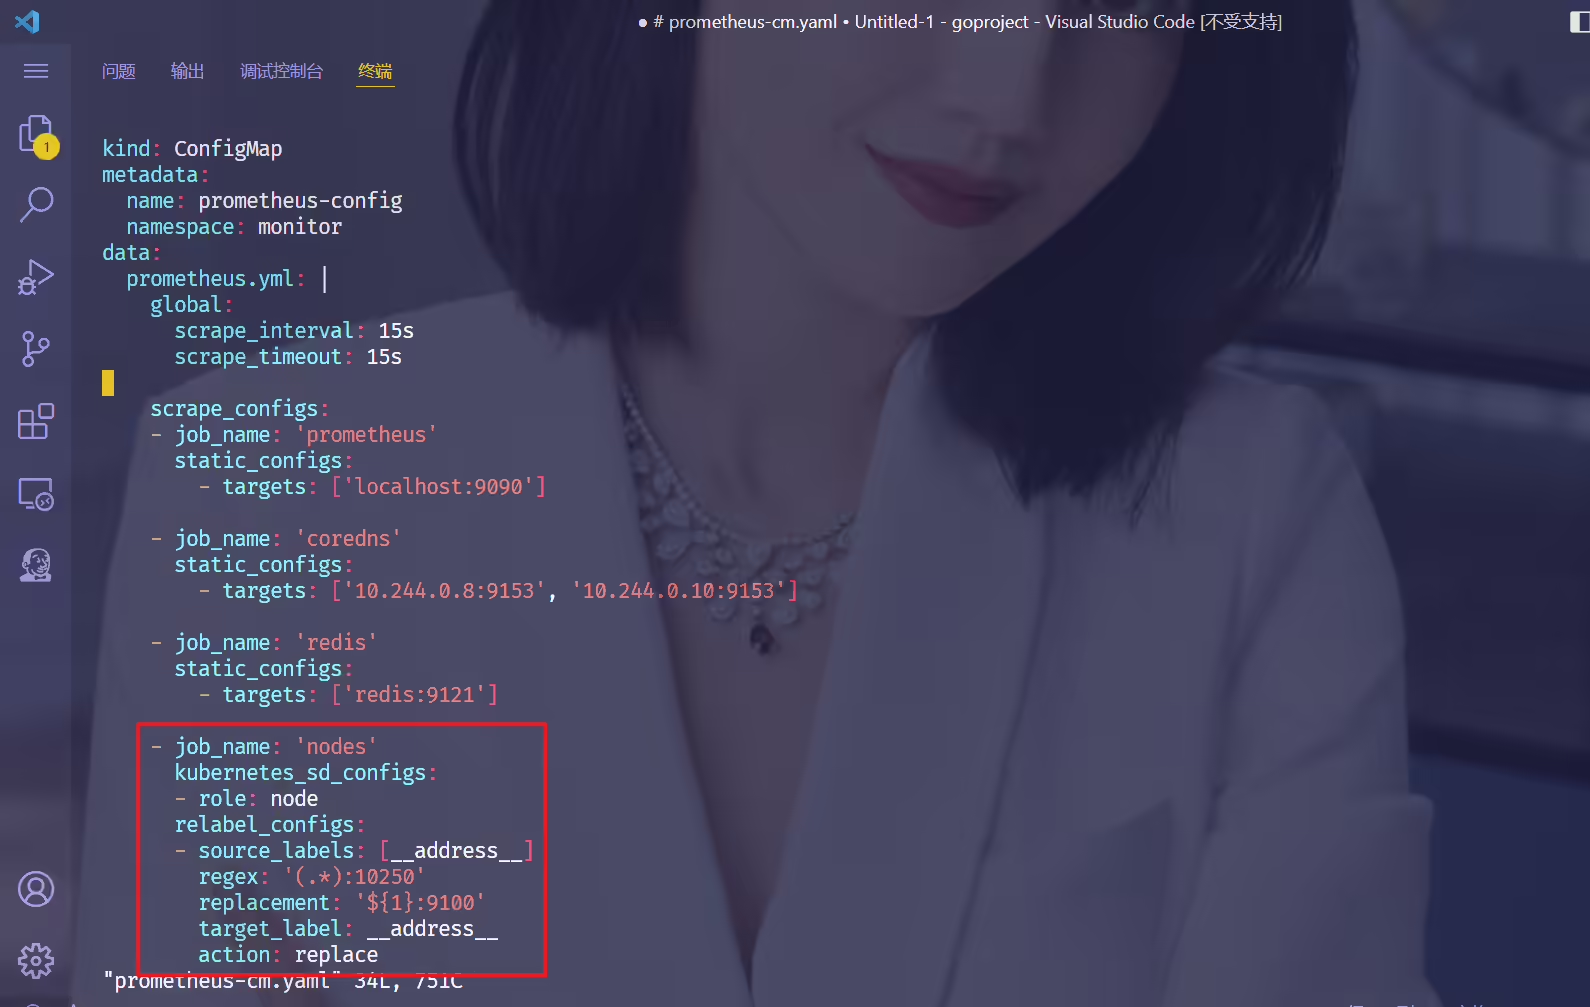
这里就是一个正则表达式,去匹配 __address__ 这个标签,然后将 host 部分保留下来,port 替换成了 9100。
更新configmap文件:
1[root@master1 prometheus-example]#kubectl apply -f prometheus-cm.yaml
2configmap/prometheus-config configured
1[root@master1 prometheus-example]# curl -X POST "http://172.29.9.51:32700/-/reload"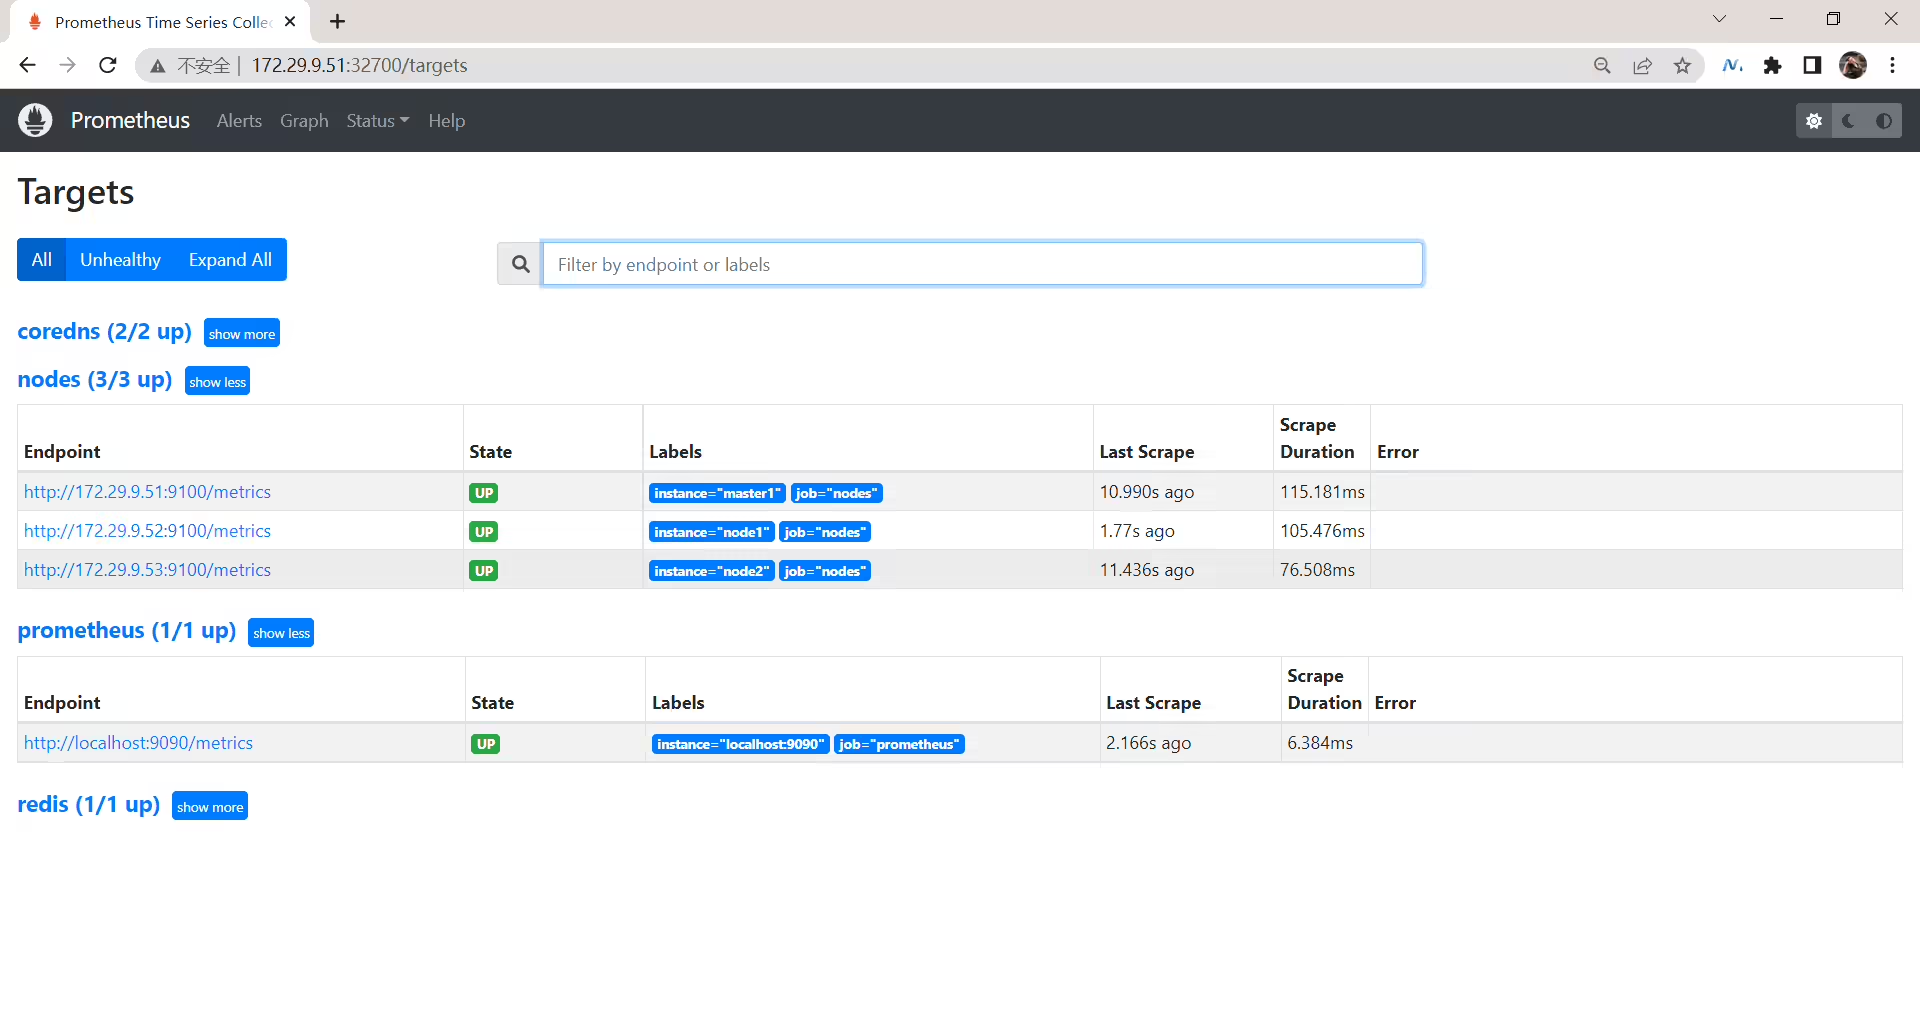
我们可以看到现在已经正常了。
labelmap 属性来将 Kubernetes 的 Label 标签添加为 Prometheus 的指标数据的标签但是还有一个问题就是我们采集的指标数据 Label 标签就只有一个节点的 hostname,这对于我们在进行监控分组分类查询的时候带来了很多不方便的地方,要是我们能够将集群中 Node 节点的 Label 标签也能获取到就很好了。
默认就是replace:
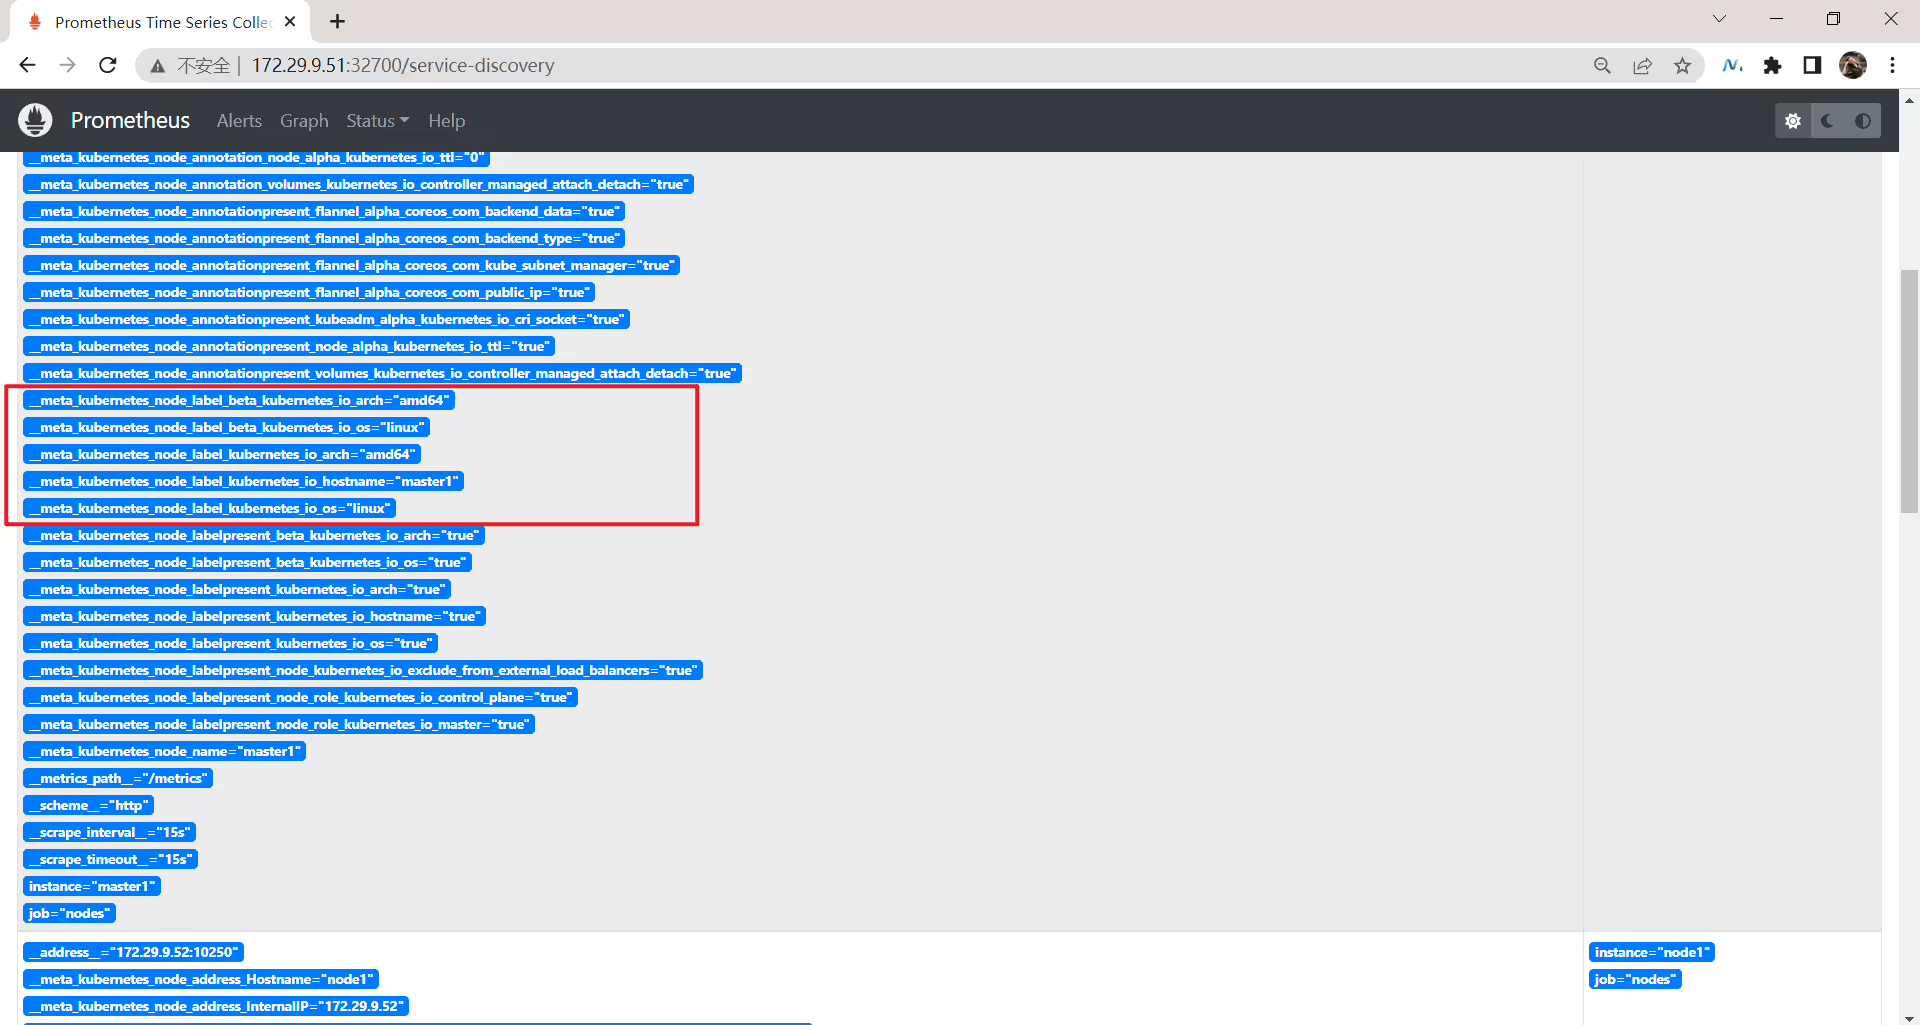
labelmap 这个属性来将 Kubernetes 的 Label 标签添加为 Prometheus 的指标数据的标签:添加到prometheus-cm.yaml配置文件:
[root@master1 prometheus-example]#pwd
/root/prometheus-example
[root@master1 prometheus-example]#vim prometheus-cm.yaml
 1# prometheus-cm.yaml
 2apiVersion: v1
 3kind: ConfigMap
 4metadata:
 5  name: prometheus-config
 6  namespace: monitor
 7data:
 8  prometheus.yml: |
 9    global:
10      scrape_interval: 15s
11      scrape_timeout: 15s
12
13    scrape_configs:
14    - job_name: 'prometheus'
15      static_configs:
16        - targets: ['localhost:9090']
17
18
19    - job_name: 'nodes'
20      kubernetes_sd_configs:
21      - role: node
22      relabel_configs:
23      - source_labels: [__address__]
24        regex: '(.*):10250'
25        replacement: '${1}:9100'
26        target_label: __address__
27        action: replace
28      - action: labelmap
29 regex: __meta_kubernetes_node_label_(.+) 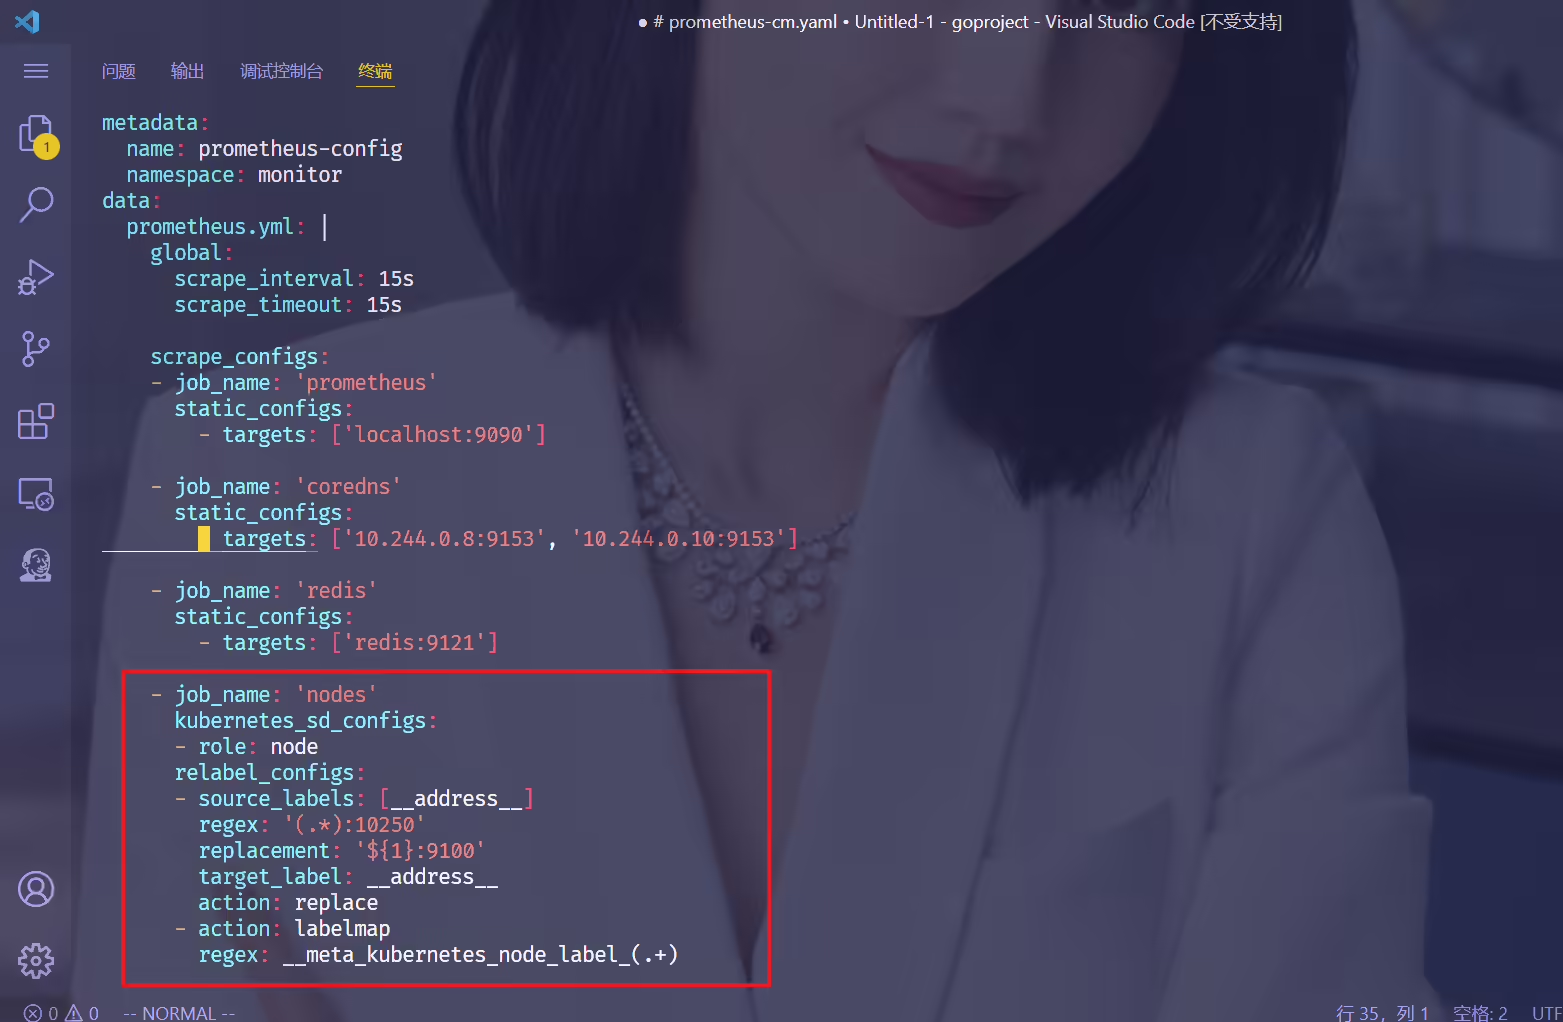
添加了一个 action 为 labelmap,正则表达式是 __meta_kubernetes_node_label_(.+) 的配置,这里的意思就是表达式中匹配都的数据也添加到指标数据的 Label 标签中去。
1[root@master1 prometheus-example]#kubectl apply -f prometheus-cm.yaml
2configmap/prometheus-config configured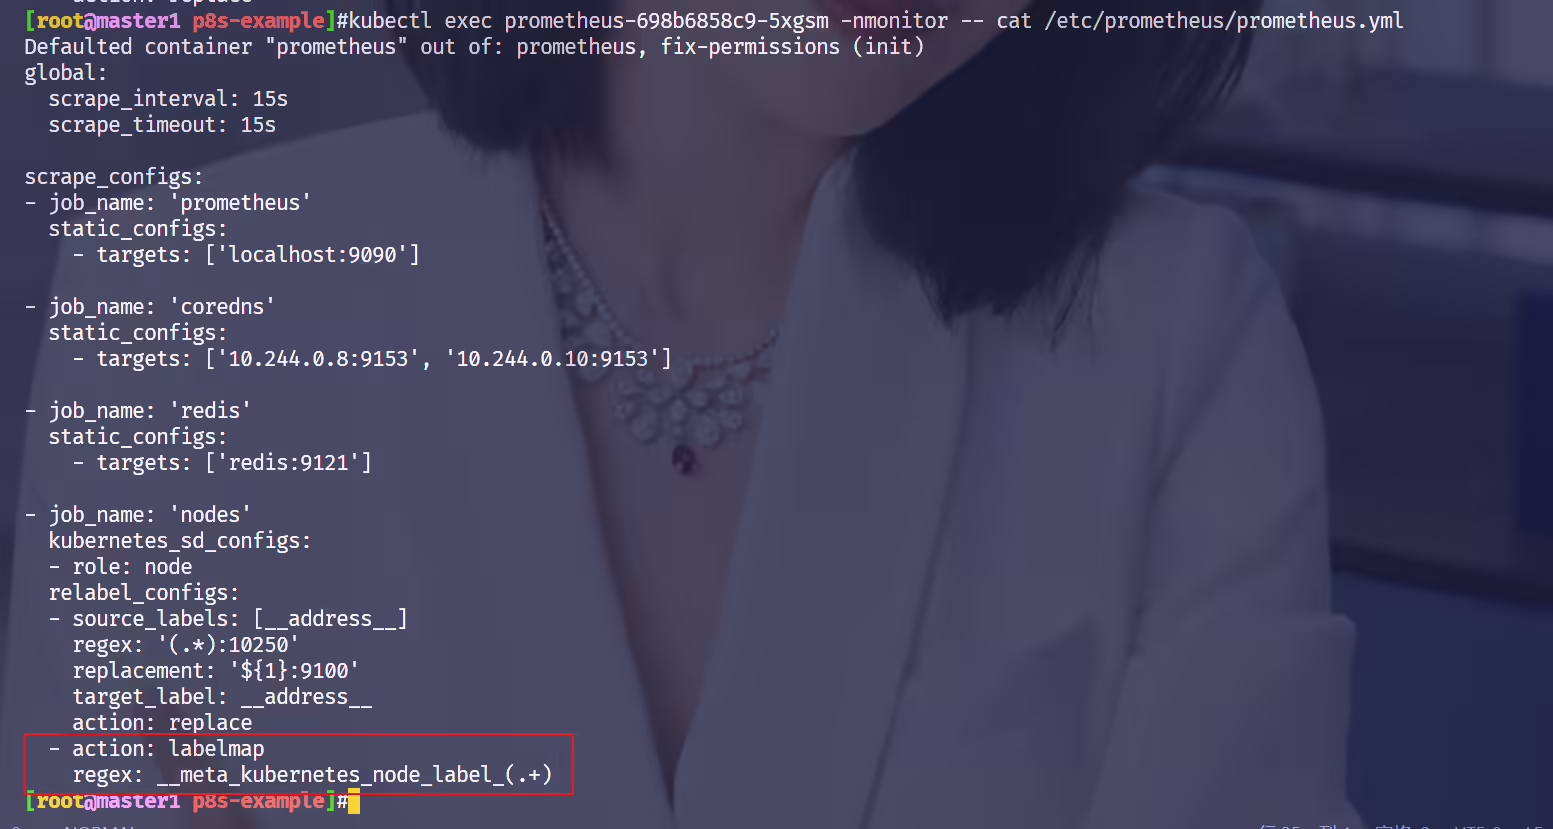
1[root@master1 prometheus-example]# curl -X POST "http://172.29.9.51:32700/-/reload"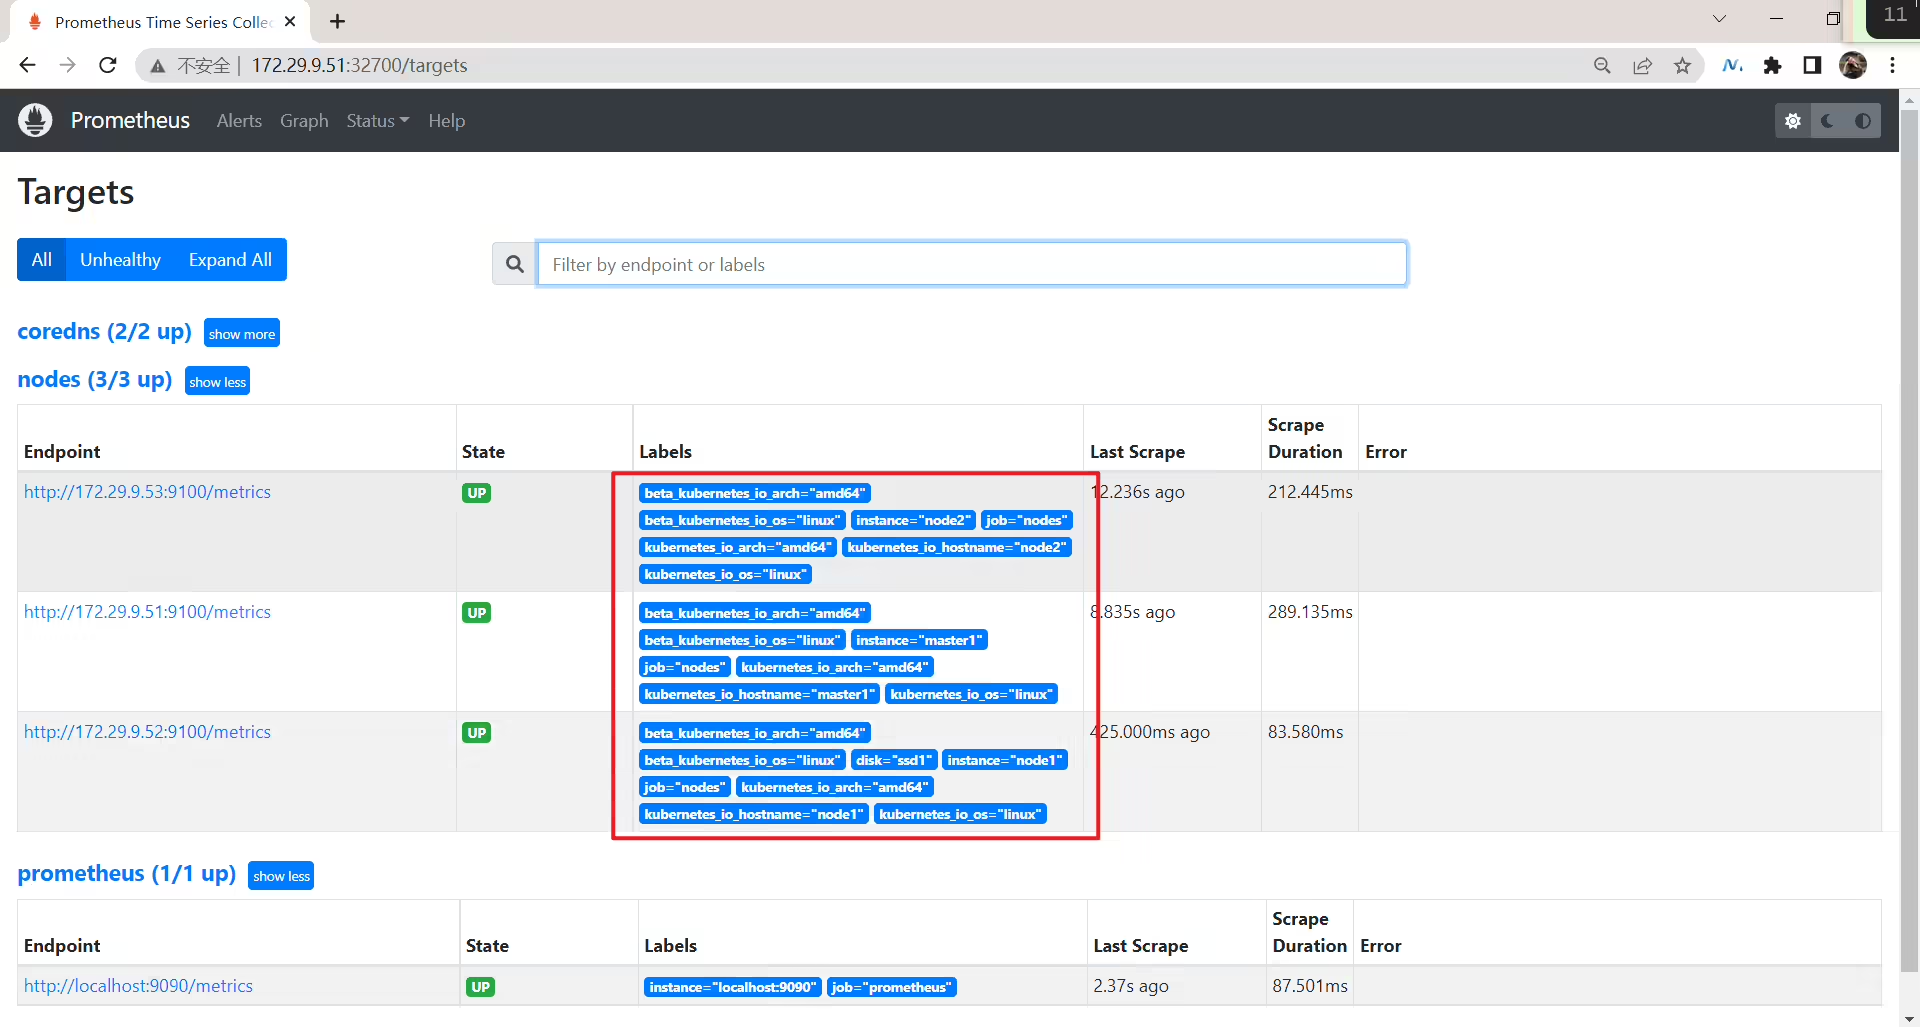
符合预期。
🍀 对于 kubernetes_sd_configs 下面可用的元信息标签如下:
__meta_kubernetes_node_name:节点对象的名称_meta_kubernetes_node_label:节点对象中的每个标签_meta_kubernetes_node_annotation:来自节点对象的每个注释_meta_kubernetes_node_address:每个节点地址类型的第一个地址(如果存在)关于 kubernets_sd_configs 更多信息可以查看官方文档:kubernetes_sd_config
🍀 另外由于 kubelet 也自带了一些监控指标数据,就上面我们提到的 10250 端口,所以我们这里也把 kubelet 的监控任务也一并配置上:
添加到prometheus-cm.yaml配置文件:
[root@master1 prometheus-example]#pwd
/root/prometheus-example
[root@master1 prometheus-example]#vim prometheus-cm.yaml
 1# prometheus-cm.yaml
 2apiVersion: v1
 3kind: ConfigMap
 4metadata:
 5  name: prometheus-config
 6  namespace: monitor
 7data:
 8  prometheus.yml: |
 9    global:
10      scrape_interval: 15s
11      scrape_timeout: 15s
12
13    scrape_configs:
14    - job_name: 'prometheus'
15      static_configs:
16        - targets: ['localhost:9090']
17
18
19    - job_name: 'nodes'
20      kubernetes_sd_configs:
21      - role: node
22      relabel_configs:
23      - source_labels: [__address__]
24        regex: '(.*):10250'
25        replacement: '${1}:9100'
26        target_label: __address__
27        action: replace
28      - action: labelmap
29        regex: __meta_kubernetes_node_label_(.+)
30
31    - job_name: 'kubelet'
32      kubernetes_sd_configs:
33      - role: node
34      scheme: https
35      tls_config:
36        ca_file: /var/run/secrets/kubernetes.io/serviceaccount/ca.crt
37        insecure_skip_verify: true
38      bearer_token_file: /var/run/secrets/kubernetes.io/serviceaccount/token
39      relabel_configs:
40      - action: labelmap
41 regex: __meta_kubernetes_node_label_(.+) 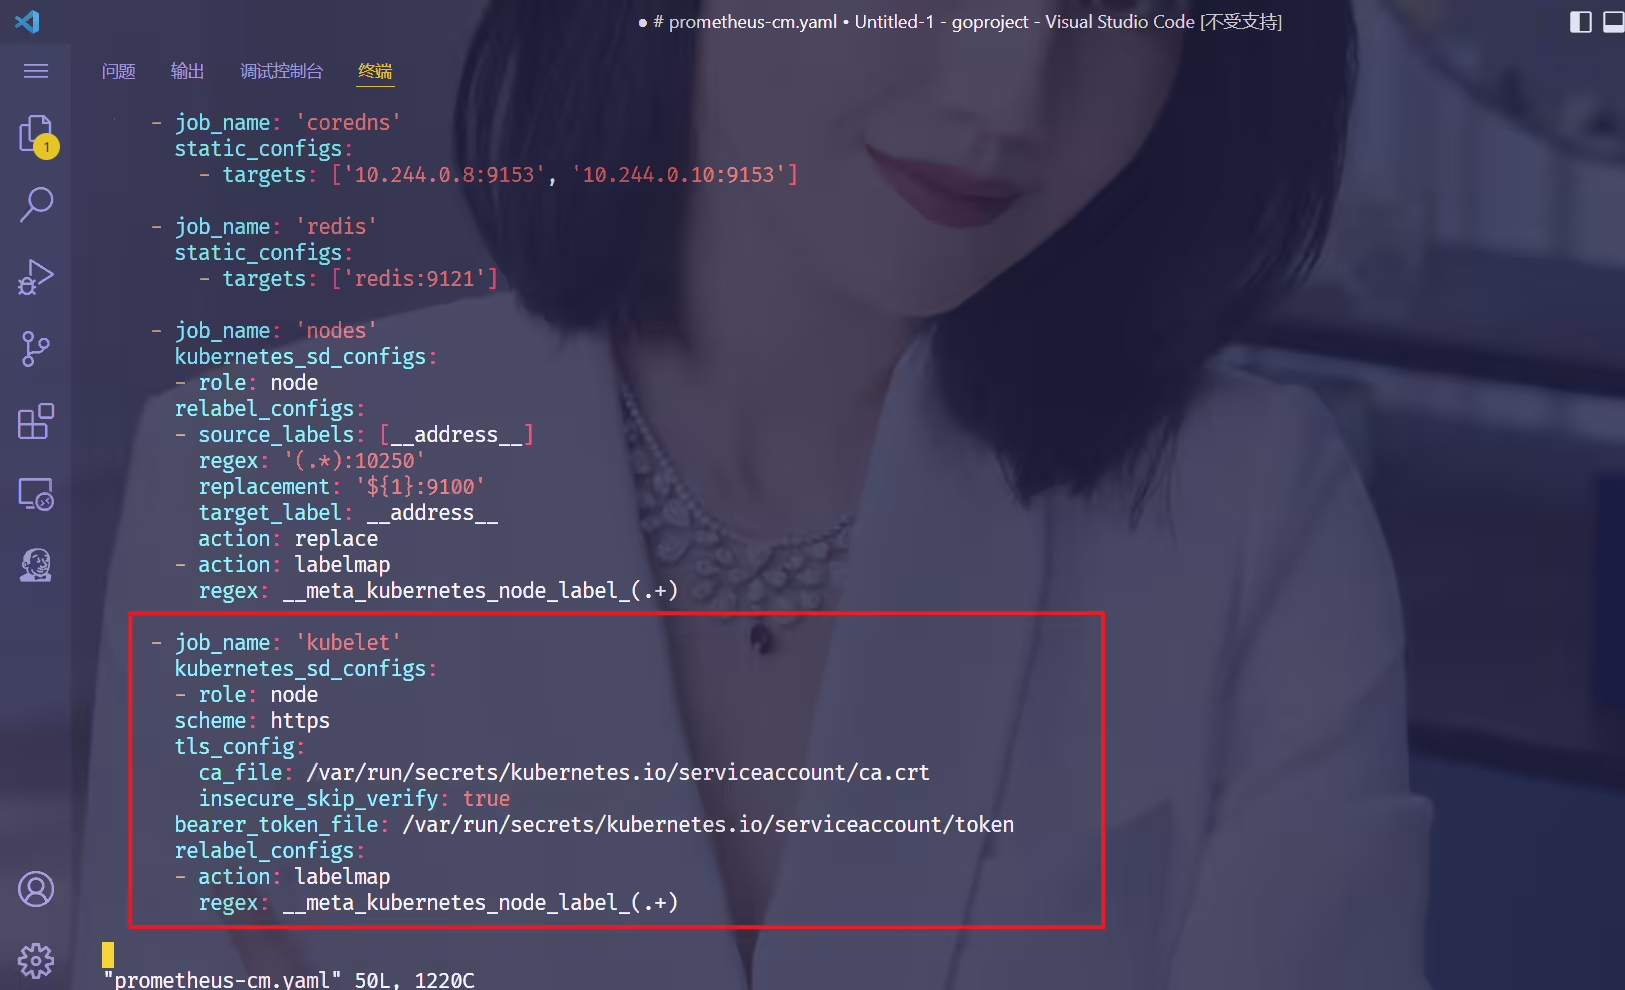
但是这里需要特别注意的是这里必须使用 https 协议访问,这样就必然需要提供证书,我们这里是通过配置 insecure_skip_verify: true 来跳过了证书校验。
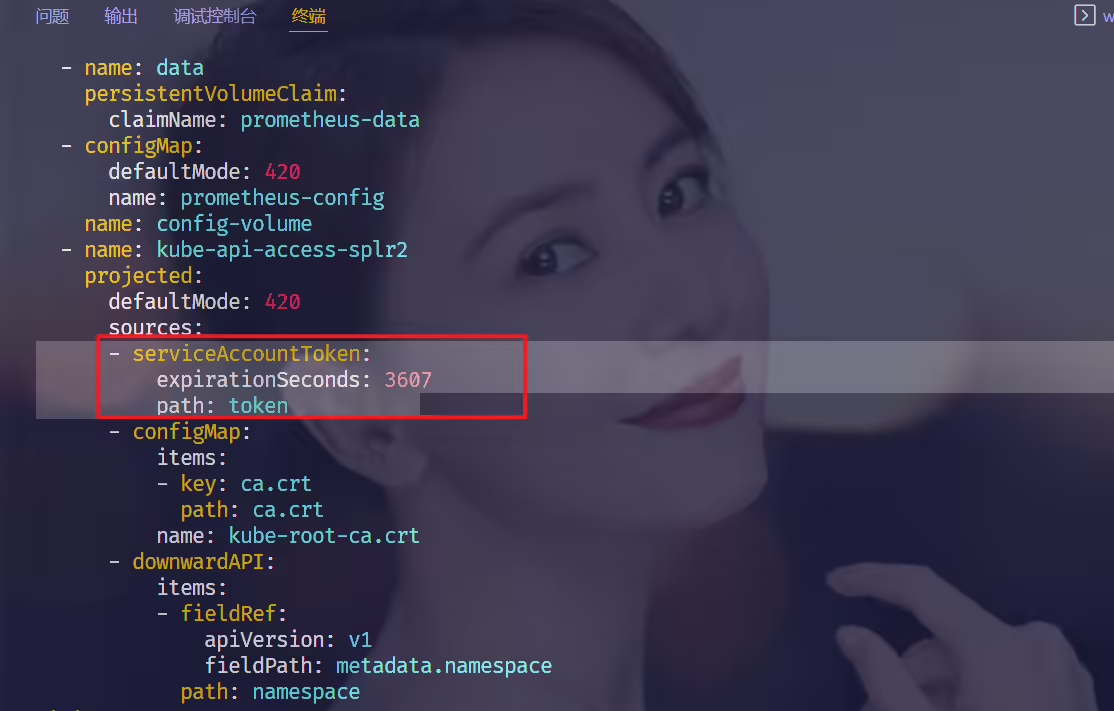
但是除此之外,要访问集群的资源,还必须要有对应的权限才可以,也就是对应的 ServiceAccount 棒的 权限允许才可以,我们这里部署的 prometheus 关联的 ServiceAccount 对象前面我们已经提到过了,这里我们只需要将 Pod 中自动注入的 /var/run/secrets/kubernetes.io/serviceaccount/ca.crt 和 /var/run/secrets/kubernetes.io/serviceaccount/token 文件配置上,就可以获取到对应的权限了。
1token就是pod里面内置的,每一个pod都有;serviceaccount -> secret -> token
2
3insecure_skip_verify: true #加上这个:只是为了不让他校验我们访问的ip;
4[root@master1 ~]#kubectl get po prometheus-698b6858c9-5xgsm -nmonitor -oyaml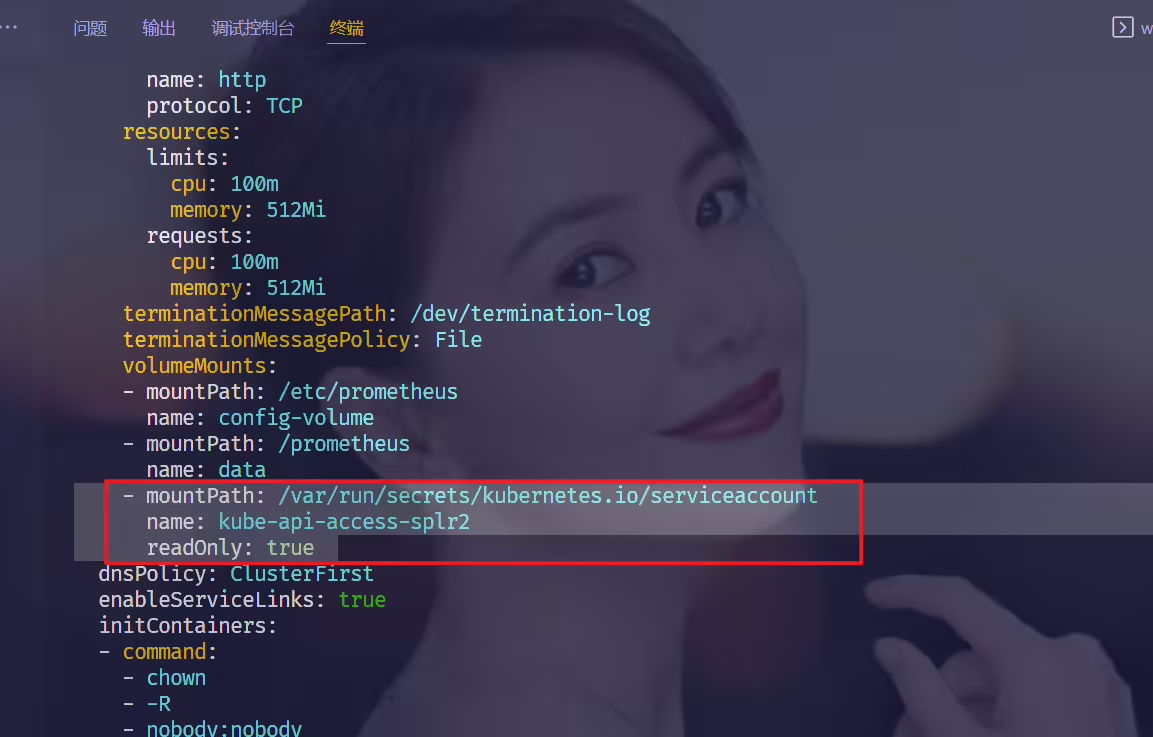
以下不影响,是可以出效果的:

1[root@master1 prometheus-example]#kubectl apply -f prometheus-cm.yaml
2configmap/prometheus-config configured1[root@master1 prometheus-example]# curl -X POST "http://172.29.9.51:32700/-/reload"现在我们再去更新下配置文件,执行 reload 操作,让配置生效,然后访问 Prometheus 的 Dashboard 查看 Targets 路径:

现在可以看到我们上面添加的 kubernetes-kubelet 和 kubernetes-nodes 这两个 job 任务都已经配置成功了,而且二者的 Labels 标签都和集群的 node 节点标签保持一致了。
现在我们就可以切换到 Graph 路径下面查看采集的一些指标数据了,比如查询 node_load1 指标:
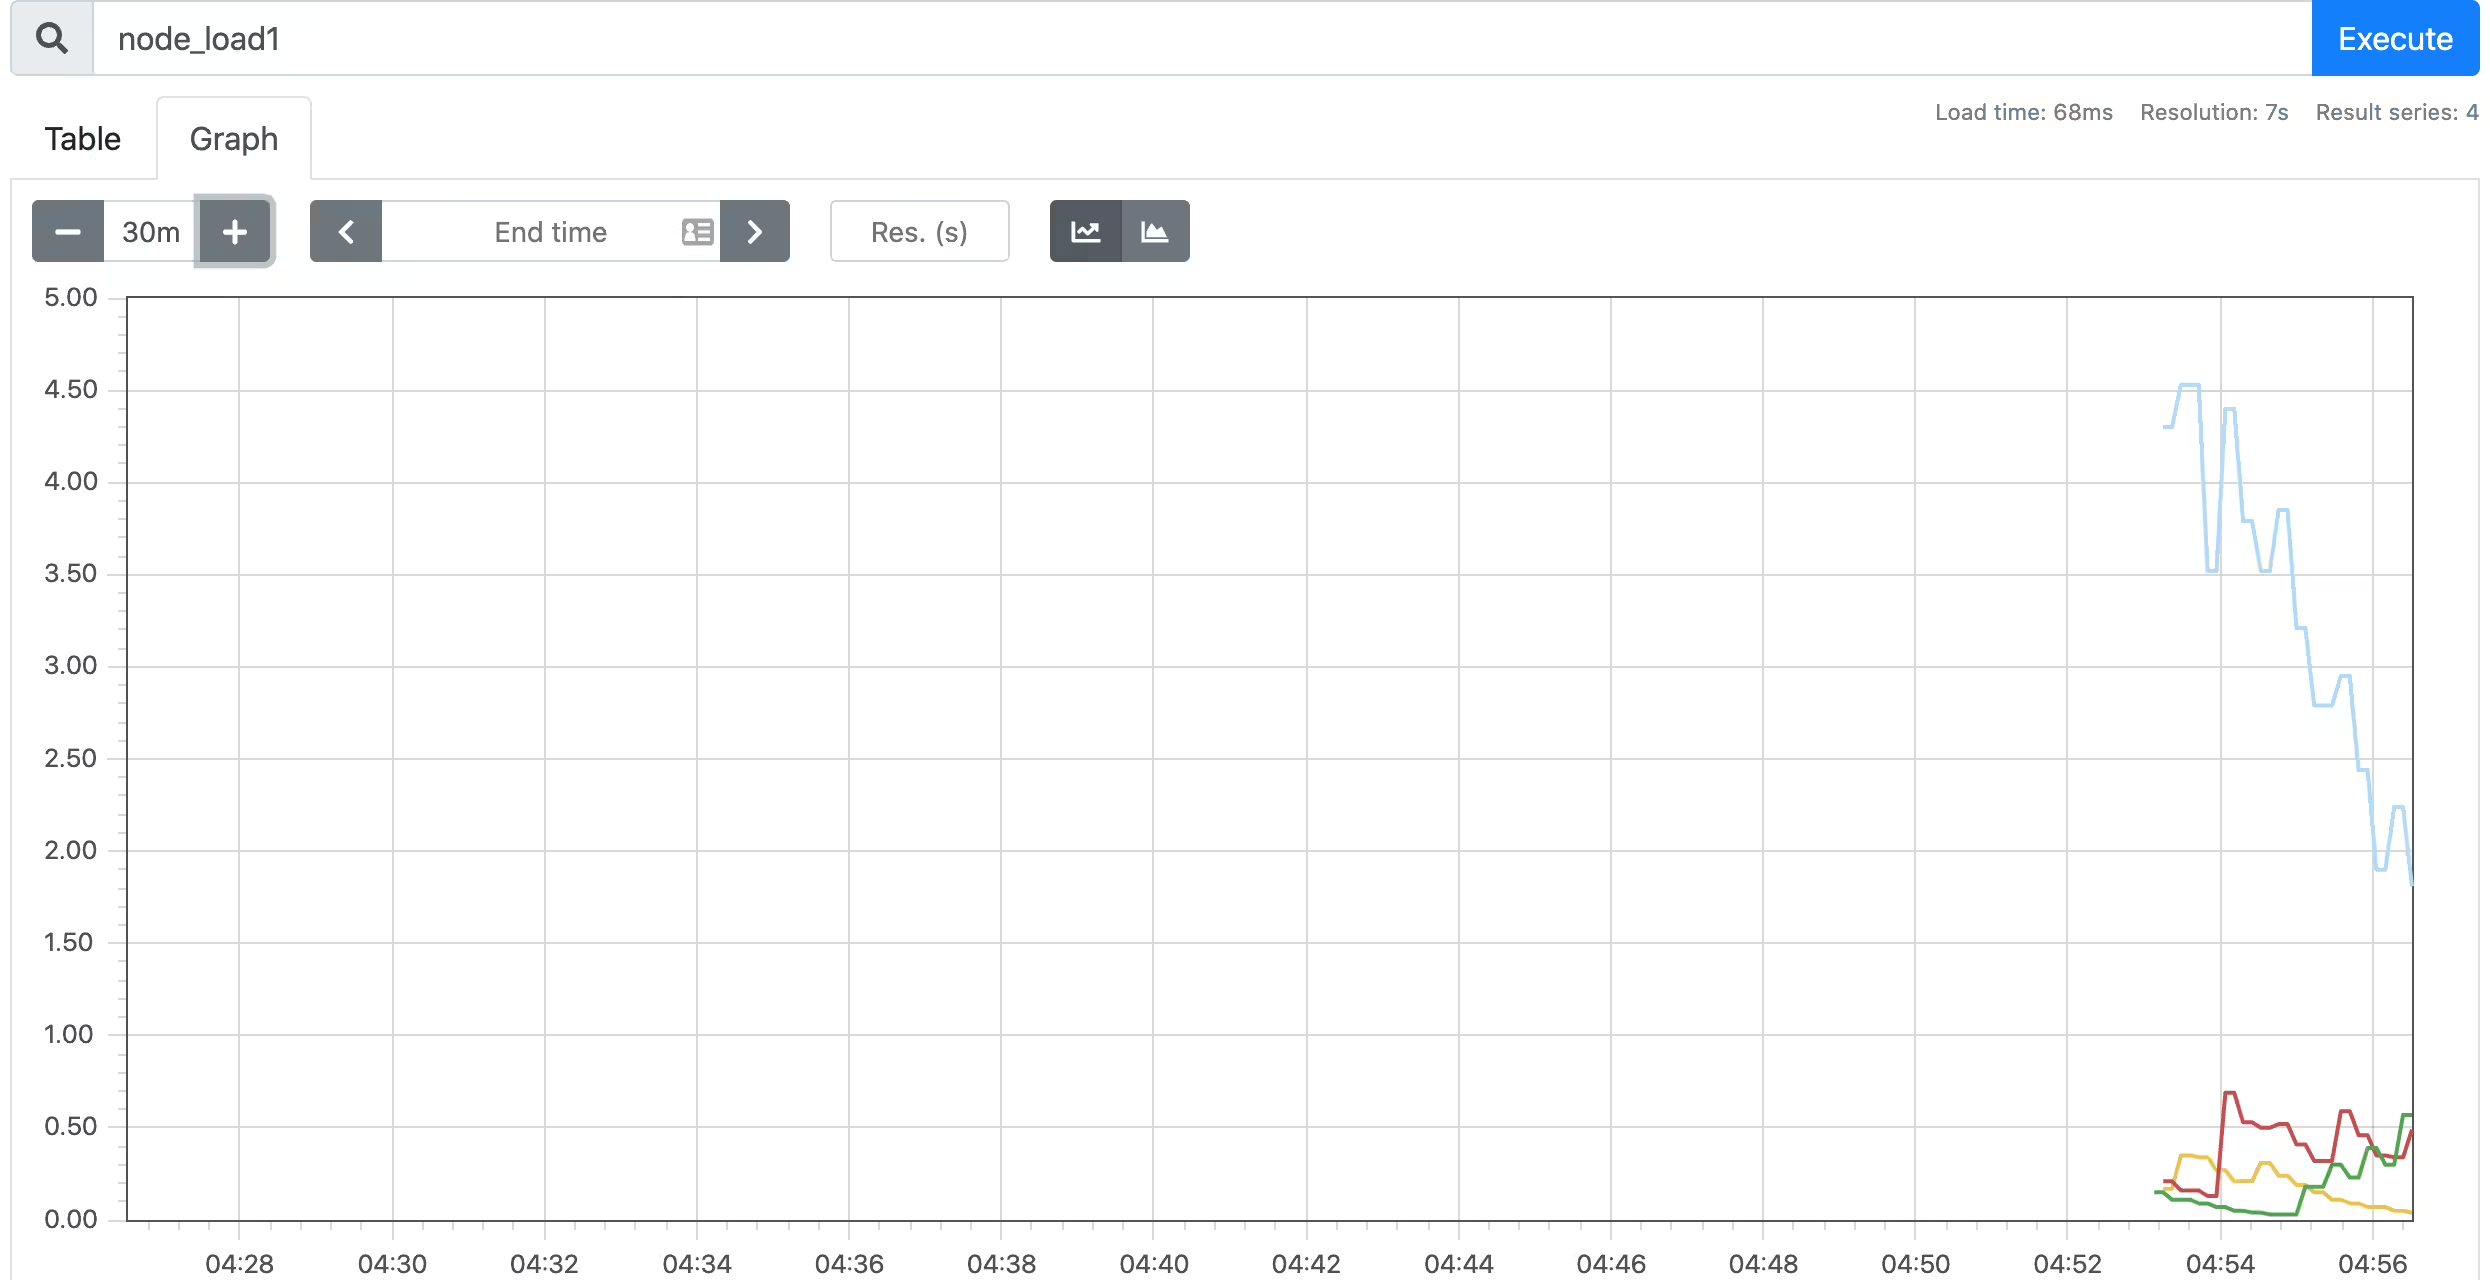
我们可以看到将几个节点对应的 node_load1 指标数据都查询出来了。
同样的,我们还可以使用 PromQL 语句来进行更复杂的一些聚合查询操作,还可以根据我们的 Labels 标签对指标数据进行聚合,比如我们这里只查询 node1 节点的数据,可以使用表达式 node_load1{instance="node1"} 来进行查询:
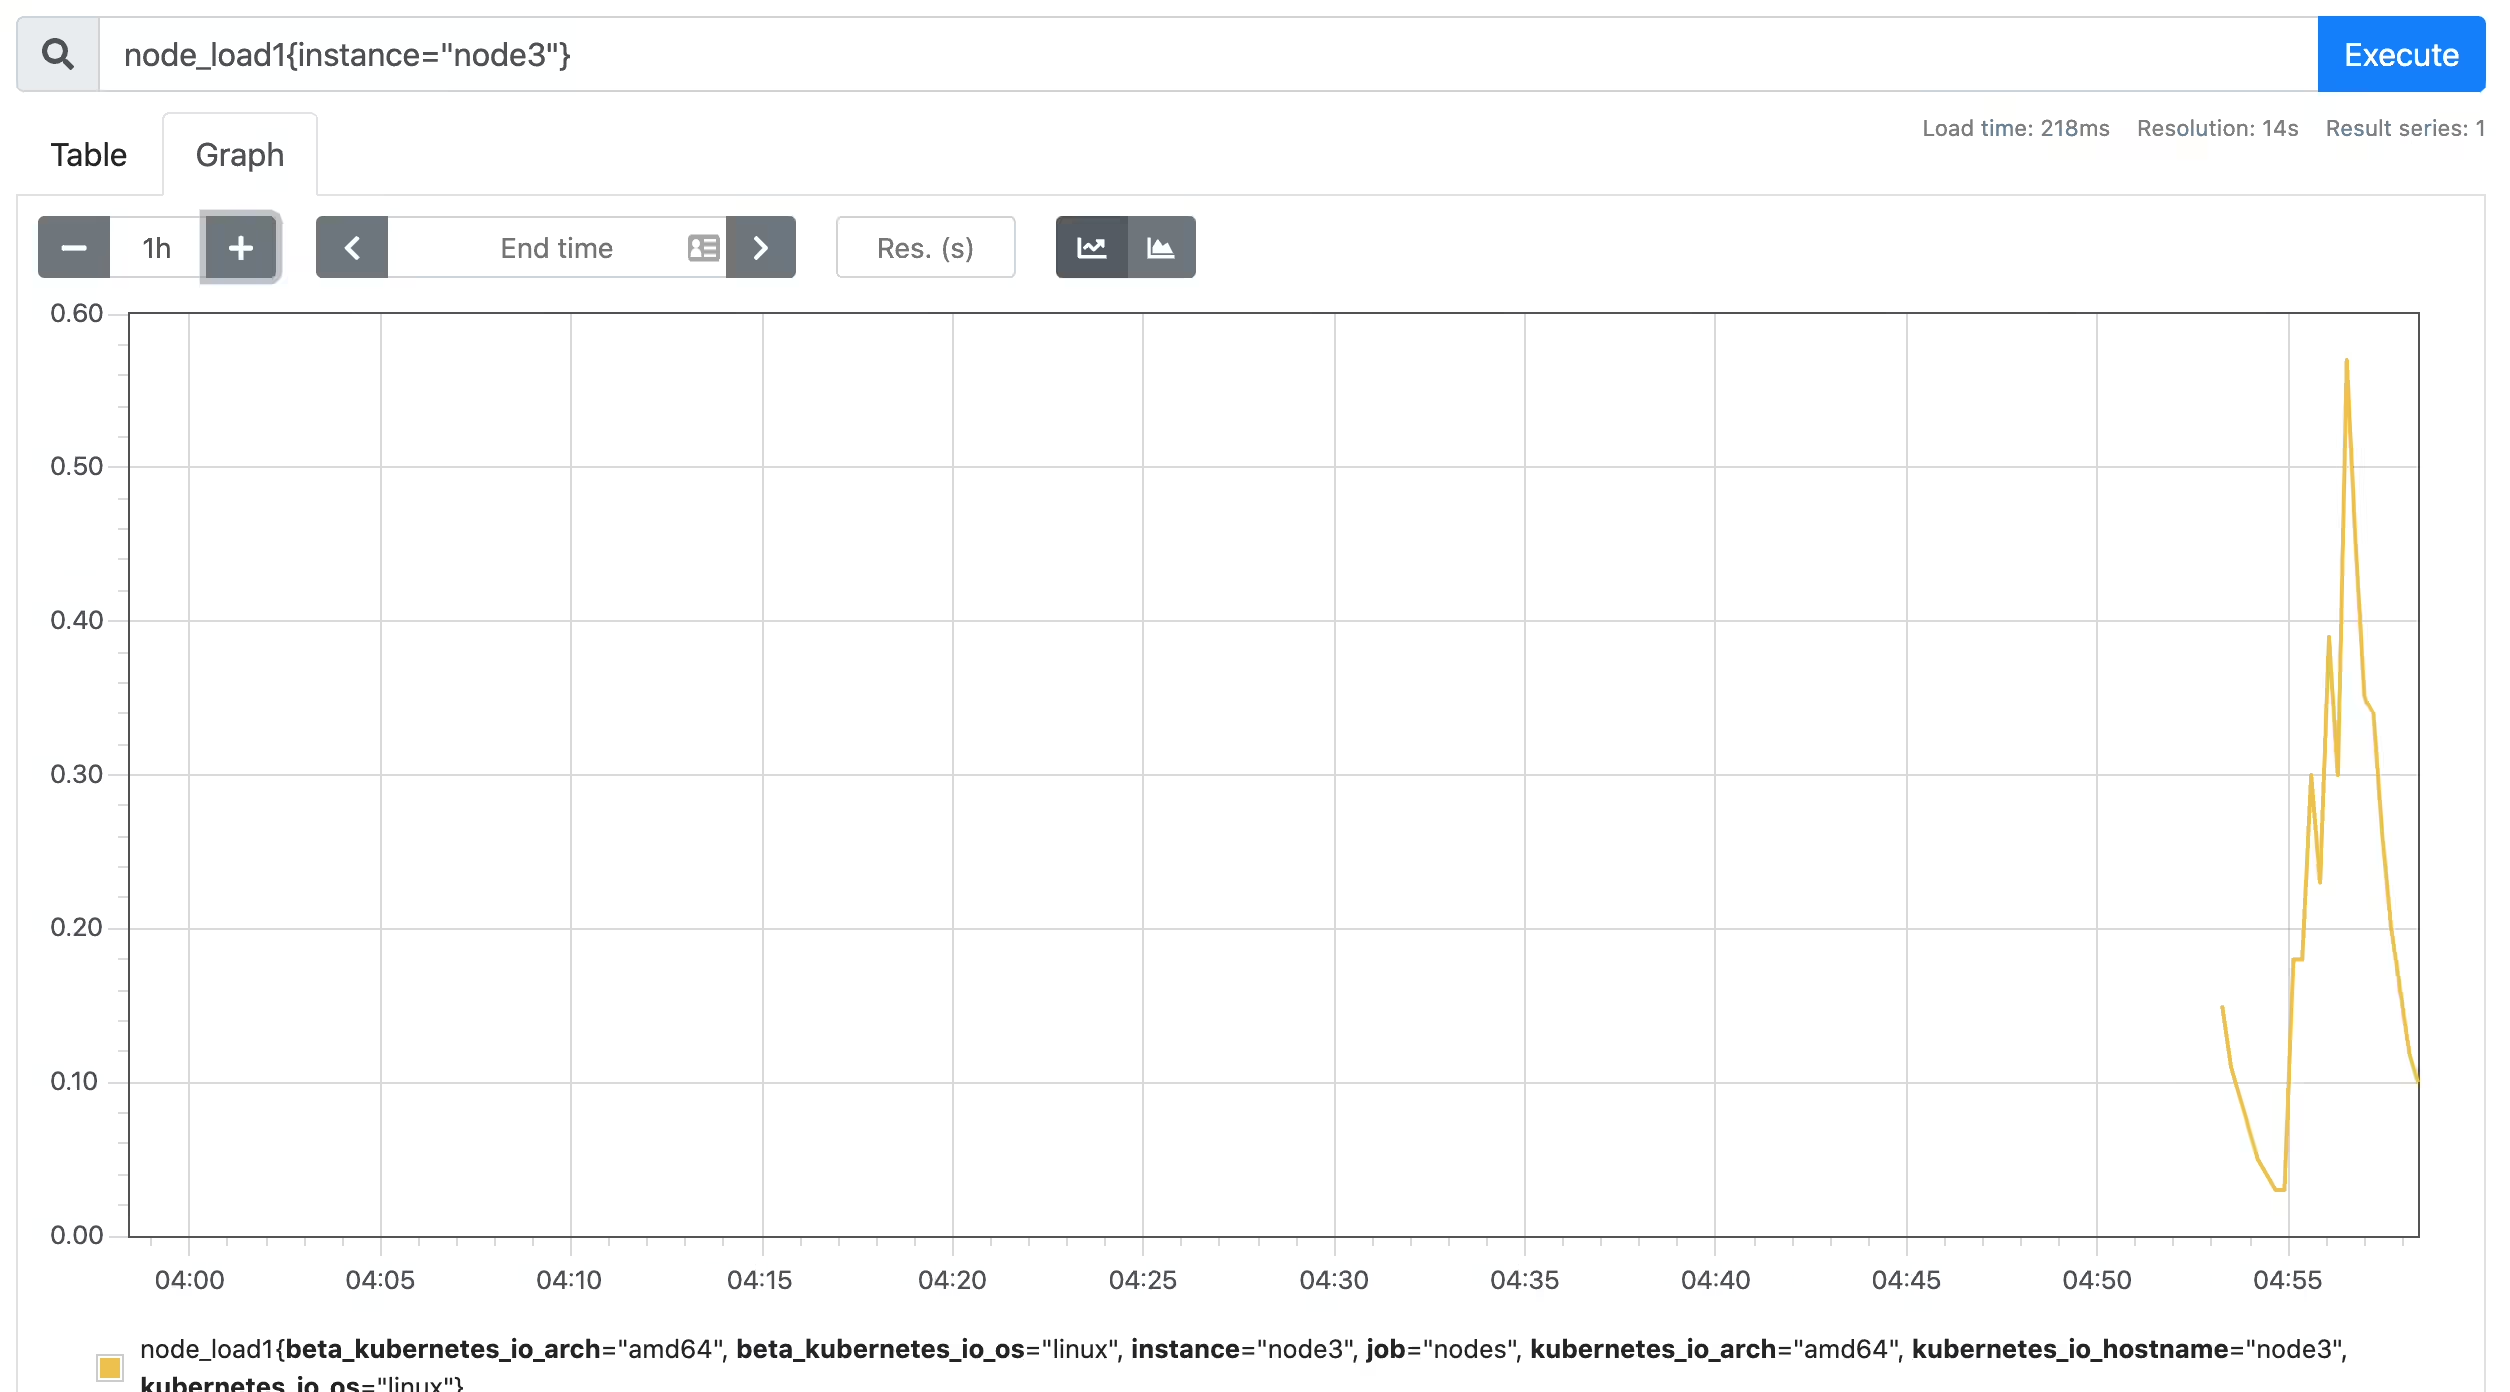
到这里我们就把 Kubernetes 集群节点使用 Prometheus 监控起来了,接下来我们再来和大家学习下怎样监控 Pod 或者 Service 之类的资源对象。
结束。
精选 · 友链 · 更多

One的公众号
爱折腾博客的小白