
快捷菜单
常用功能一站直达
更多功能请点顶栏「快捷菜单」

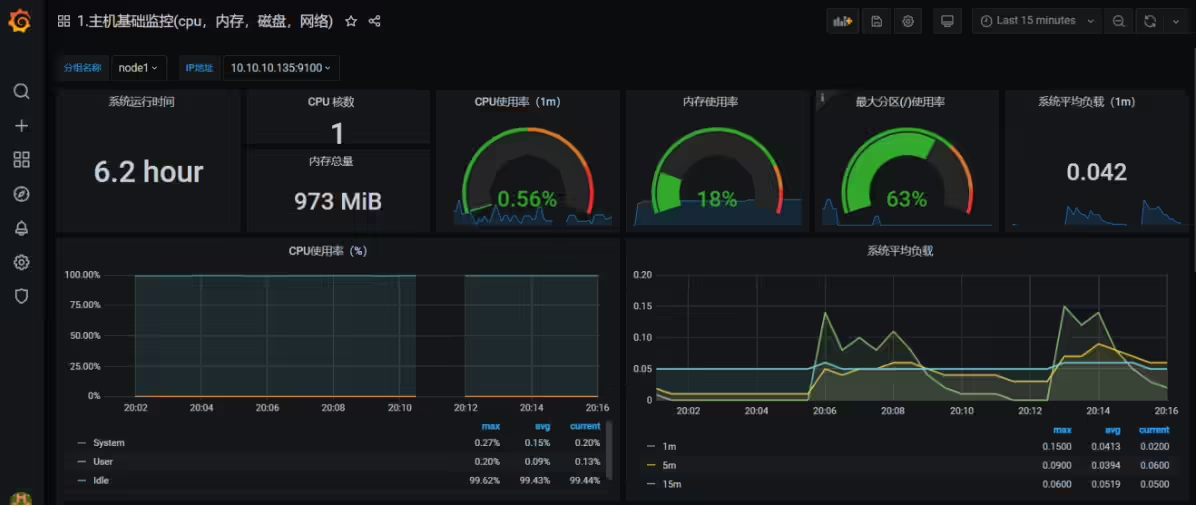
这节课我们来学习二进制安装prometheus,然后使用Node Exporter来采集主机信息,由prometheus server来定时向node exporter拉取数据并使用Grafana进行图形化的展示。
1grafana-7.2.1.linux-amd64.tar
2node_exporter-1.0.1.linux-amd64.tar
3prometheus-2.23.0.linux-amd64.tar
4
5模板文件:`主机基础监控(cpu,内存,磁盘,网络).json`,将其导入即可; 1#本次次prometheus server主机名设置为:prometheus,其余2个target节点主机名如下:
2hostnamectl --static set-hostname prometheus
3exec bash
4hostnamectl --static set-hostname node1
5exec bash
6hostnamectl --static set-hostname node2
7exec bash
8
9#配置ip过程省略:
10192.168.10.10 prometheus
11192.168.10.11 node1
12192.168.10.12 node2
13
14#本次虚机网卡选择为nat模式,仅主机模式也行,只要保证他们之间能互访即可;1#另建议:关闭防火墙/NetwokManager/selinux(3台都需要配置)
2systemctl stop firewalld#如果未关闭防火墙的话,其9090端口将无法访问;
3systemctl disable firewalld
4
5systemctl stop NetworkManager
6systemctl disable NetworkManager
7
8setenforce 0
9sed -i s/SELINUX=enforcing/SELINUX=disabled/ /etc/selinux/config 
Prometheus基于Golang编写,编译后的软件包,不依赖于任何的第三方依赖。用户只需要下载对应平台的二进制包,解压并且添加基本的配置即可正常使用Prometheus Server。
prometheus的官网https://prometheus.io/
 安装包下载链接https://prometheus.io/download/
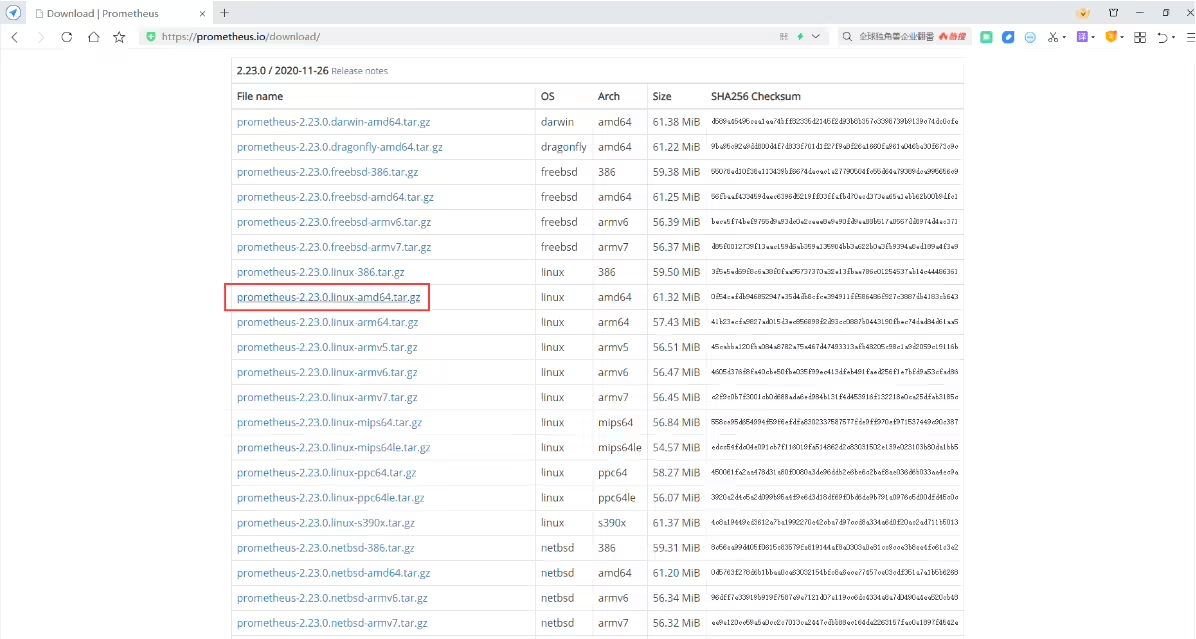
截止目前(2020年11月30日)最新的二进制包版本是[prometheus-2.23.0.linux-amd64.tar.gz],链接如下:
首先,将刚下载好的prometheus-2.23.0.linux-amd64.tar.gz软件包上传到192.168.10.10-prometheus机器上,再执行如下命令:
1[root@prometheus ~]# mv prometheus-2.23.0.linux-amd64.tar.gz /usr/local/
2[root@prometheus ~]# cd /usr/local/
3[root@prometheus local]# tar xf prometheus-2.23.0.linux-amd64.tar.gz
4[root@prometheus local]# ls
5bin  games    lib    libexec      prometheus-2.22.0.linux-amd64.tar.gz  share
6etc  include  lib64  prometheus-2.22.0.linux-amd64  sbin           src
7[root@prometheus local]# mv prometheus-2.23.0.linux-amd64 prometheus解压后在prometheus的安装目录/usr/local/prometheus里面,包含默认地prometheus.yml配置文件。
1[root@prometheus local]# pwd
2/usr/local
3[root@prometheus local]# ls
4bin  etc  games  include  lib  lib64  libexec  prometheus  prometheus-2.23.0.linux-amd64.tar.gz  sbin  share  src
5[root@prometheus local]# ls prometheus
6console_libraries  consoles  LICENSE  NOTICE  prometheus  prometheus.yml  promtool
7[root@prometheus local]#查看prometheus.yml配置文件内容:
 1[root@prometheus local]# pwd
 2/usr/local
 3[root@prometheus local]# cat /usr/local/prometheus/prometheus.yml
 4# my global config
 5global:
 6  scrape_interval:     15s # Set the scrape interval to every 15 seconds. Default is every 1 minute.
 7  evaluation_interval: 15s # Evaluate rules every 15 seconds. The default is every 1 minute.
 8  # scrape_timeout is set to the global default (10s).
 9
10# Alertmanager configuration
11alerting:
12  alertmanagers:
13  - static_configs:
14    - targets:
15      # - alertmanager:9093
16
17# Load rules once and periodically evaluate them according to the global 'evaluation_interval'.
18rule_files:
19  # - "first_rules.yml"
20  # - "second_rules.yml"
21
22# A scrape configuration containing exactly one endpoint to scrape:
23# Here it's Prometheus itself.
24scrape_configs:
25  # The job name is added as a label `job=<job_name>` to any timeseries scraped from this config.
26  - job_name: 'prometheus'
27
28    # metrics_path defaults to '/metrics'
29    # scheme defaults to 'http'.
30
31    static_configs:
32    - targets: ['localhost:9090']
33[root@prometheus local]#为了安全,尽量使用普通用户来启动prometheus服务。
1[root@prometheus local]# useradd -s /sbin/nologin -M prometheusprometheus的数据默认会存放在应用所在目录下,这里我们修改为/data/prometheus:
1[root@prometheus local]# mkdir /data/prometheus -p
2[root@prometheus local]# chown -R prometheus:prometheus /usr/local/prometheus
3[root@prometheus local]# chown -R prometheus:prometheus /data/prometheus/prometheus的启动很简单,只需要直接启动解压目录的二进制文件prometheus,然后再加上一些参数即可。
 1[root@prometheus local]# vim /usr/lib/systemd/system/prometheus.service
 2[Unit]
 3Description=Prometheus
 4Documentation=https://prometheus.io/
 5After=network.target
 6
 7[Service]
 8Type=simple
 9ExecStart=/usr/local/prometheus/prometheus --config.file=/usr/local/prometheus/prometheus.yml --storage.tsdb.path=/data/prometheus
10ExecStop=/bin/kill -s QUIT $MAINPID
11Restart=on-failure
12User=prometheus
13
14[Install]
15WantedBy=multi-user.target
16
17#不要忘记执行
18[root@prometheus local]# systemctl daemon-reload 1#启动prometheus并设置为开机自启动
2[root@prometheus local]# systemctl enable --now prometheus
3Created symlink from /etc/systemd/system/multi-user.target.wants/prometheus.service to /usr/lib/systemd/system/prometheus.service.
4
5#查看prometheus服务状态
6[root@prometheus local]# systemctl status prometheus
7● prometheus.service - Prometheus
8 Loaded: loaded (/usr/lib/systemd/system/prometheus.service; enabled; vendor preset: disabled)
9 Active: active (running) since Fri 2021-01-29 07:17:49 CST; 12s ago
10 Docs: https://prometheus.io/
11 Main PID: 1916 (prometheus)
12 CGroup: /system.slice/prometheus.service
13 └─1916 /usr/local/prometheus/prometheus --config.file=/usr/local/prometheus/prometheus.yml --storage.tsdb.path=/data/prometheus
14
15Jan 29 07:17:49 prometheus prometheus[1916]: level=info ts=2021-01-28T23:17:49.337Z caller=head.go:645 component=tsdb msg="Replaying on-disk memo...s if any"
16Jan 29 07:17:49 prometheus prometheus[1916]: level=info ts=2021-01-28T23:17:49.337Z caller=head.go:659 component=tsdb msg="On-disk memory mappabl…on=12.223µs
17Jan 29 07:17:49 prometheus prometheus[1916]: level=info ts=2021-01-28T23:17:49.337Z caller=head.go:665 component=tsdb msg="Replaying WAL, this ma... a while"
18Jan 29 07:17:49 prometheus prometheus[1916]: level=info ts=2021-01-28T23:17:49.338Z caller=head.go:717 component=tsdb msg="WAL segment loaded" se...Segment=0
19Jan 29 07:17:49 prometheus prometheus[1916]: level=info ts=2021-01-28T23:17:49.338Z caller=head.go:722 component=tsdb msg="WAL replay completed" …ion=431.8µs
20Jan 29 07:17:49 prometheus prometheus[1916]: level=info ts=2021-01-28T23:17:49.340Z caller=main.go:742 fs_type=XFS_SUPER_MAGIC
21Jan 29 07:17:49 prometheus prometheus[1916]: level=info ts=2021-01-28T23:17:49.340Z caller=main.go:745 msg="TSDB started"
22Jan 29 07:17:49 prometheus prometheus[1916]: level=info ts=2021-01-28T23:17:49.340Z caller=main.go:871 msg="Loading configuration file" filename=...theus.yml
23Jan 29 07:17:49 prometheus prometheus[1916]: level=info ts=2021-01-28T23:17:49.354Z caller=main.go:902 msg="Completed loading of configuration file" filen…µs
24Jan 29 07:17:49 prometheus prometheus[1916]: level=info ts=2021-01-28T23:17:49.355Z caller=main.go:694 msg="Server is ready to receive web requests."
25Hint: Some lines were ellipsized, use -l to show in full.
26
27#查看prometheus服务所使用的的端口号
28[root@prometheus local]# ss -tnlp
29State Recv-Q Send-Q Local Address:Port Peer Address:Port
30LISTEN 0 100 127.0.0.1:25 *:* users:(("master",pid=1226,fd=13))
31LISTEN 0 128 *:22 *:* users:(("sshd",pid=1014,fd=3))
32LISTEN 0 100 [::1]:25 [::]:* users:(("master",pid=1226,fd=14))
33LISTEN 0 128 [::]:9090 [::]:* users:(("prometheus",pid=1916,fd=9))
34LISTEN 0 128 [::]:22 [::]:* users:(("sshd",pid=1014,fd=4))
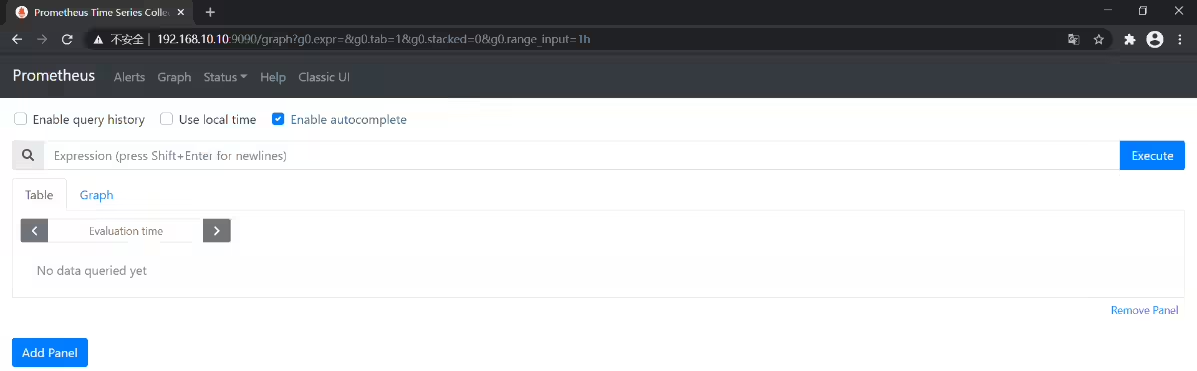
35[root@prometheus local]# 我们看到有9090端口,然后直接以IP:Port的方式来访问:(在自己笔记本上进行测试)
http://192.168.10.10:9090
还可以查看到当前正在被监控的主机,这里只有我们当前部署的这台。如下所示:
点击Status—>Targets可以看到
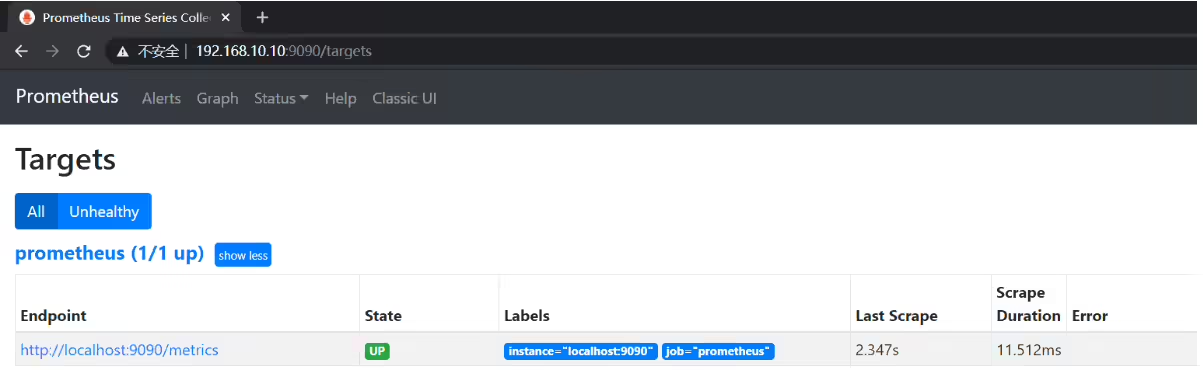
从UP状态可以看的出来节点是正常的。
node exporter的作用:收集操作系统的基本系统, 例如cpu, 内存, 硬盘空间等基本信息, 并对外提供api接口,用于prometheus查询存储。
**备注:**以下配置在node1和node2都要执行。(我们这边先在node1上执行,后在node2执行一样的操作)
node exporter最新的版本是1.0.1。下载链接:https://github.com/prometheus/node_exporter/releases/download/v1.0.1/node_exporter-1.0.1.linux-amd64.tar.gz
首先,将刚下载好的node_exporter-1.0.1.linux-amd64.tar软件包上传到node1和node2机器上,再执行如下命令:
 1[root@node1 ~]# mv node_exporter-1.0.1.linux-amd64.tar.gz  /usr/local
 2[root@node1 ~]# cd /usr/local
 3[root@node1 local]# tar xf node_exporter-1.0.1.linux-amd64.tar.gz
 4[root@node1 local]# mv node_exporter-1.0.1.linux-amd64 node_exporter
 5
 6#查看node_exporter相关文件
 7[root@node1 local]# pwd
 8/usr/local
 9[root@node1 local]# ls
10bin  etc  games  include  lib  lib64  libexec  node_exporter  node_exporter-1.0.1.linux-amd64.tar.gz  sbin  share  src
11[root@node1 local]# cd node_exporter
12[root@node1 node_exporter]# ll -h
13total 19M
14-rw-r--r--. 1 3434 3434 12K Jun 16  2020 LICENSE
15-rwxr-xr-x. 1 3434 3434 19M Jun 16  2020 node_exporter
16-rw-r--r--. 1 3434 3434 463 Jun 16 2020 NOTICEnode exporter无需修改配置文件,安装上去之后可以直接启动。 node exporter的二进制启动文件在/usr/local/node_exporter目录下面。这里我们直接以nohup的方式来启动这个服务。
 1[root@node1 local]# nohup /usr/local/node_exporter/node_exporter > /dev/null 2>&1 &
 2[1] 2547
 3[root@node1 local]# ps -ef|grep 2547
 4root       2547   1876  0 07:36 pts/0    00:00:00 /usr/local/node_exporter/node_exporter
 5root       2552   1876  0 07:37 pts/0    00:00:00 grep --color=auto 2547
 6[root@node1 local]# ss -tnlp
 7State       Recv-Q Send-Q                           Local Address:Port                                          Peer Address:Port
 8LISTEN      0      100                                  127.0.0.1:25                                                       *:*                   users:(("master",pid=1220,fd=13))
 9LISTEN      0      128                                          *:22                                                       *:*                   users:(("sshd",pid=1007,fd=3))
10LISTEN      0      100                                      [::1]:25                                                    [::]:*                   users:(("master",pid=1220,fd=14))
11LISTEN      0      128                                       [::]:9100                                                  [::]:*                   users:(("node_exporter",pid=2547,fd=3))
12LISTEN      0      128                                       [::]:22                                                    [::]:*                   users:(("sshd",pid=1007,fd=4))
13[root@node1 local]#
14node exporter默认地端口是9100,只要能看到端口,说明服务启动是没有问题的。接下来按照相同的方法把第二个节点完成配置:
1[root@node2 local]# ss -tnlp
2State       Recv-Q Send-Q                                 Local Address:Port                                                Peer Address:Port
3LISTEN      0      100                                        127.0.0.1:25                                                             *:*                   users:(("master",pid=1223,fd=13))
4LISTEN      0      128                                                *:22                                                             *:*                   users:(("sshd",pid=1005,fd=3))
5LISTEN      0      100                                            [::1]:25                                                          [::]:*                   users:(("master",pid=1223,fd=14))
6LISTEN      0      128                                             [::]:9100                                                        [::]:*                   users:(("node_exporter",pid=2534,fd=3))
7LISTEN      0      128                                             [::]:22                                                          [::]:*                   users:(("sshd",pid=1005,fd=4))
8[root@node2 local]# node exporter直接写在Linux系统启动脚本/etc/rc.local文件里面即可。当然,最后赋予x执行权限
1[root@node1 local]# vim /etc/rc.local
2#!/bin/bash
3
4touch /var/lock/subsys/local #默认就存在的
5nohup /usr/local/node_exporter/node_exporter > /dev/null 2>&1 &
6[root@node1 local]# chmod +x /etc/rc.local 接下来按照相同的方法把第二个节点完成配置:
1[root@node2 local]# vim /etc/rc.local
2#!/bin/bash
3
4touch /var/lock/subsys/local #默认就存在的
5nohup /usr/local/node_exporter/node_exporter > /dev/null 2>&1 &
6[root@node2 local]# chmod +x /etc/rc.local node exporter启动后暴露出来9100端口,是为了让prometheus server去抓取这个主机上面的日志。所以我们需要在prometheus中配置一下这个接口。 编辑prometheus.yml文件,增加后面的3行数据。
1[root@prometheus local]# vim /usr/local/prometheus/prometheus.yml #注意,这边配置时要留意yaml格式问题
2- job_name: 'node1'
3    static_configs:
4    - targets: ['192.168.10.11:9100']
5- job_name: 'node2'
6    static_configs:
7    - targets: ['192.168.10.12:9100']
然后重启prometheus,再次打开prometheus的web页面,即可看到现在所监控的主机:
1systemctl restart prometheus
备注:
2行注释加一行指标的值:

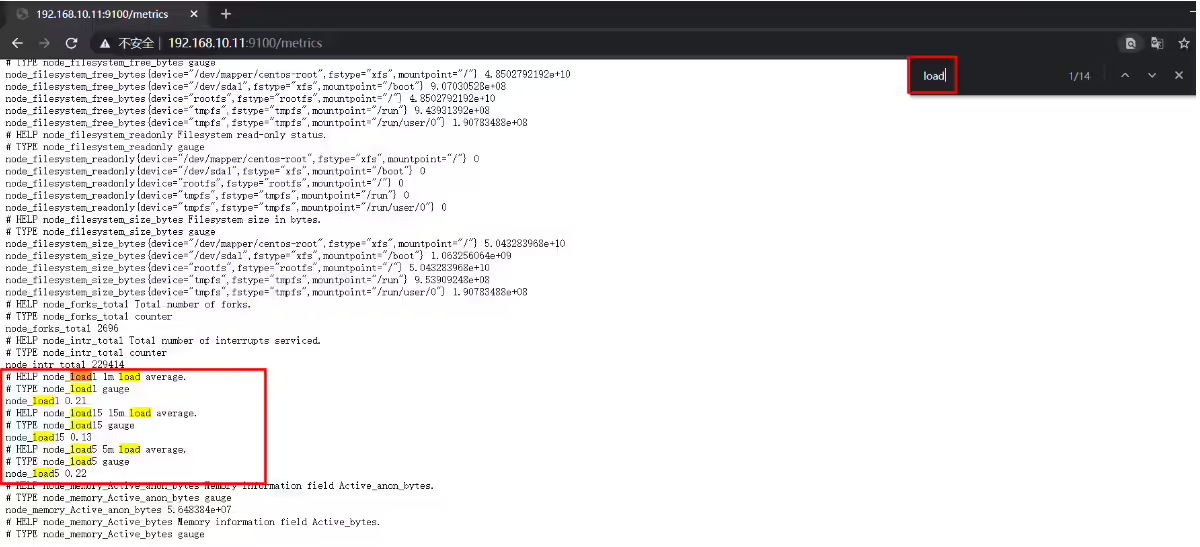
grafana和prometheus我们都安装在一台机器上面。
grafana的官网:https://grafana.com/
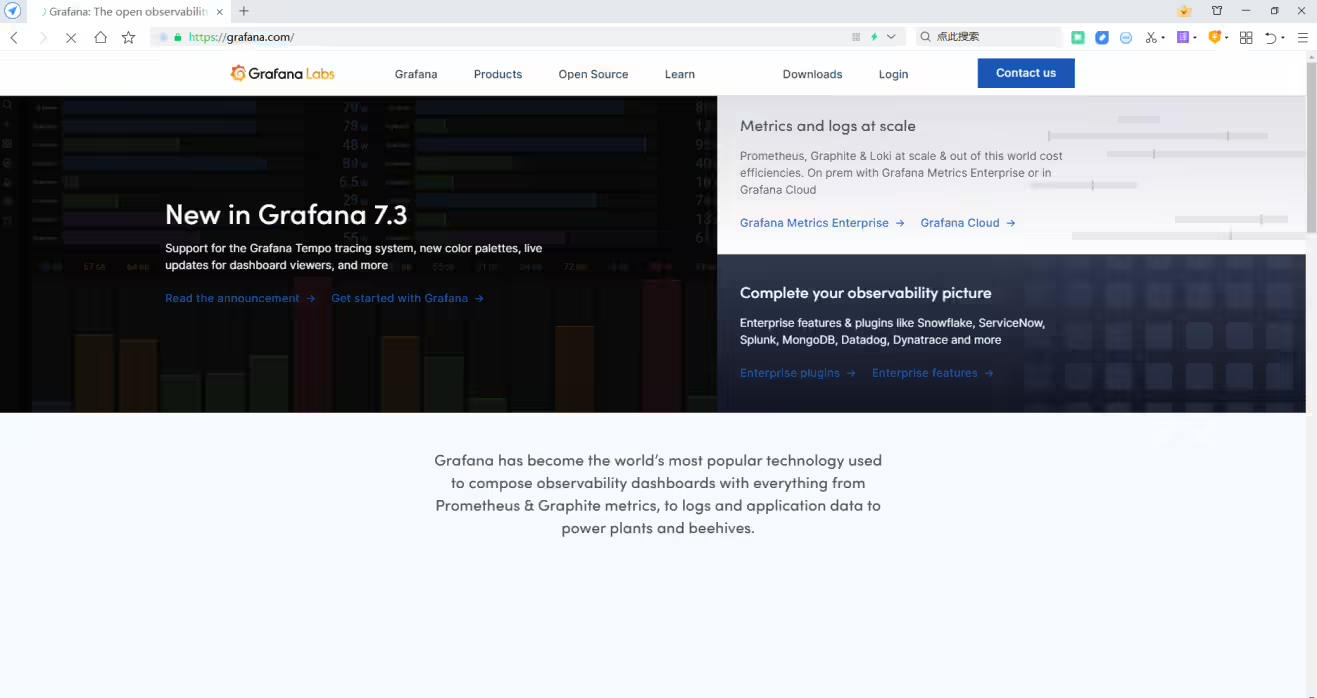
最新版本grafana-7.2.1,下载链接https://dl.grafana.com/oss/release/grafana-7.2.1.linux-amd64.tar.gz
首先,将刚下载好的ngrafana-7.2.1.linux-amd64.tar软件包上传到prometheus机器上,再执行如下命令:
这里我们依然安装到/usr/local目录下:
1[root@prometheus ~]# ls
2grafana-7.2.1.linux-amd64.tar.gz
3[root@prometheus ~]# mv grafana-7.2.1.linux-amd64.tar.gz /usr/local
4[root@prometheus ~]# cd /usr/local
5[root@prometheus local]# tar xf grafana-7.2.1.linux-amd64.tar.gz
6[root@prometheus local]# mv grafana-7.2.1 grafana1[root@prometheus local]# useradd -s /sbin/nologin -M grafana1[root@prometheus local]# mkdir /data/grafana
2[root@prometheus local]# chown -R grafana:grafana /usr/local/grafana
3[root@prometheus local]# chown -R grafana:grafana /data/grafana/grafana的配置文件为/usr/local/grafana/conf/defaults.ini文件,配置为上面新建的数据目录。
配置文件里面参数比较多,我们大概修改下面4个参数即可,后期需要了再另改其他参数。
1[root@prometheus local]# vim /usr/local/grafana/conf/defaults.ini #修改如下内容后,保存退出
2data = /data/grafana/data
3logs = /data/grafana/log
4plugins = /data/grafana/plugins
5provisioning = /data/grafana/conf/provisioning 1grafana启动的时候指定一下启动的安装家目录。
2[root@prometheus ~]# vim /usr/lib/systemd/system/grafana-server.service
3[Unit]
4Description=Grafana
5After=network.target
6
7[Service]
8User=grafana
9Group=grafana
10Type=notify
11ExecStart=/usr/local/grafana/bin/grafana-server -homepath /usr/local/grafana
12ExecStop=/bin/kill -s QUIT $MAINPID
13Restart=on-failure
14
15[Install]
16WantedBy=multi-user.target
17
18记得daemon-reload一下
19[root@prometheus ~]# systemctl daemon-reload1[root@prometheus local]# systemctl enable --now grafana-server
2Created symlink from /etc/systemd/system/multi-user.target.wants/grafana-server.service to /usr/lib/systemd/system/grafana-server.service.
3[root@prometheus local]#grafana的默认端口是3000,访问的地址是IP:3000;
可以通过ss -tnlp命令查看服务是否有正常启动;
1[root@prometheus local]# ss -tnlp
2State       Recv-Q Send-Q                                 Local Address:Port                                                Peer Address:Port
3LISTEN      0      100                                        127.0.0.1:25                                                             *:*                   users:(("master",pid=1170,fd=13))
4LISTEN      0      128                                                *:22                                                             *:*                   users:(("sshd",pid=962,fd=3))
5LISTEN      0      128                                             [::]:3000                                                        [::]:*                   users:(("grafana-server",pid=1558,fd=8))
6LISTEN      0      100                                            [::1]:25                                                          [::]:*                   users:(("master",pid=1170,fd=14))
7LISTEN      0      128                                             [::]:9090                                                        [::]:*                   users:(("prometheus",pid=965,fd=14))
8LISTEN      0      128                                             [::]:22                                                          [::]:*                   users:(("sshd",pid=962,fd=4))
9[root@prometheus local]#
我这里访问ip为:http://192.168.10.10:3000 默认地账号密码是admin/admin,登录之后会强制修改密码;
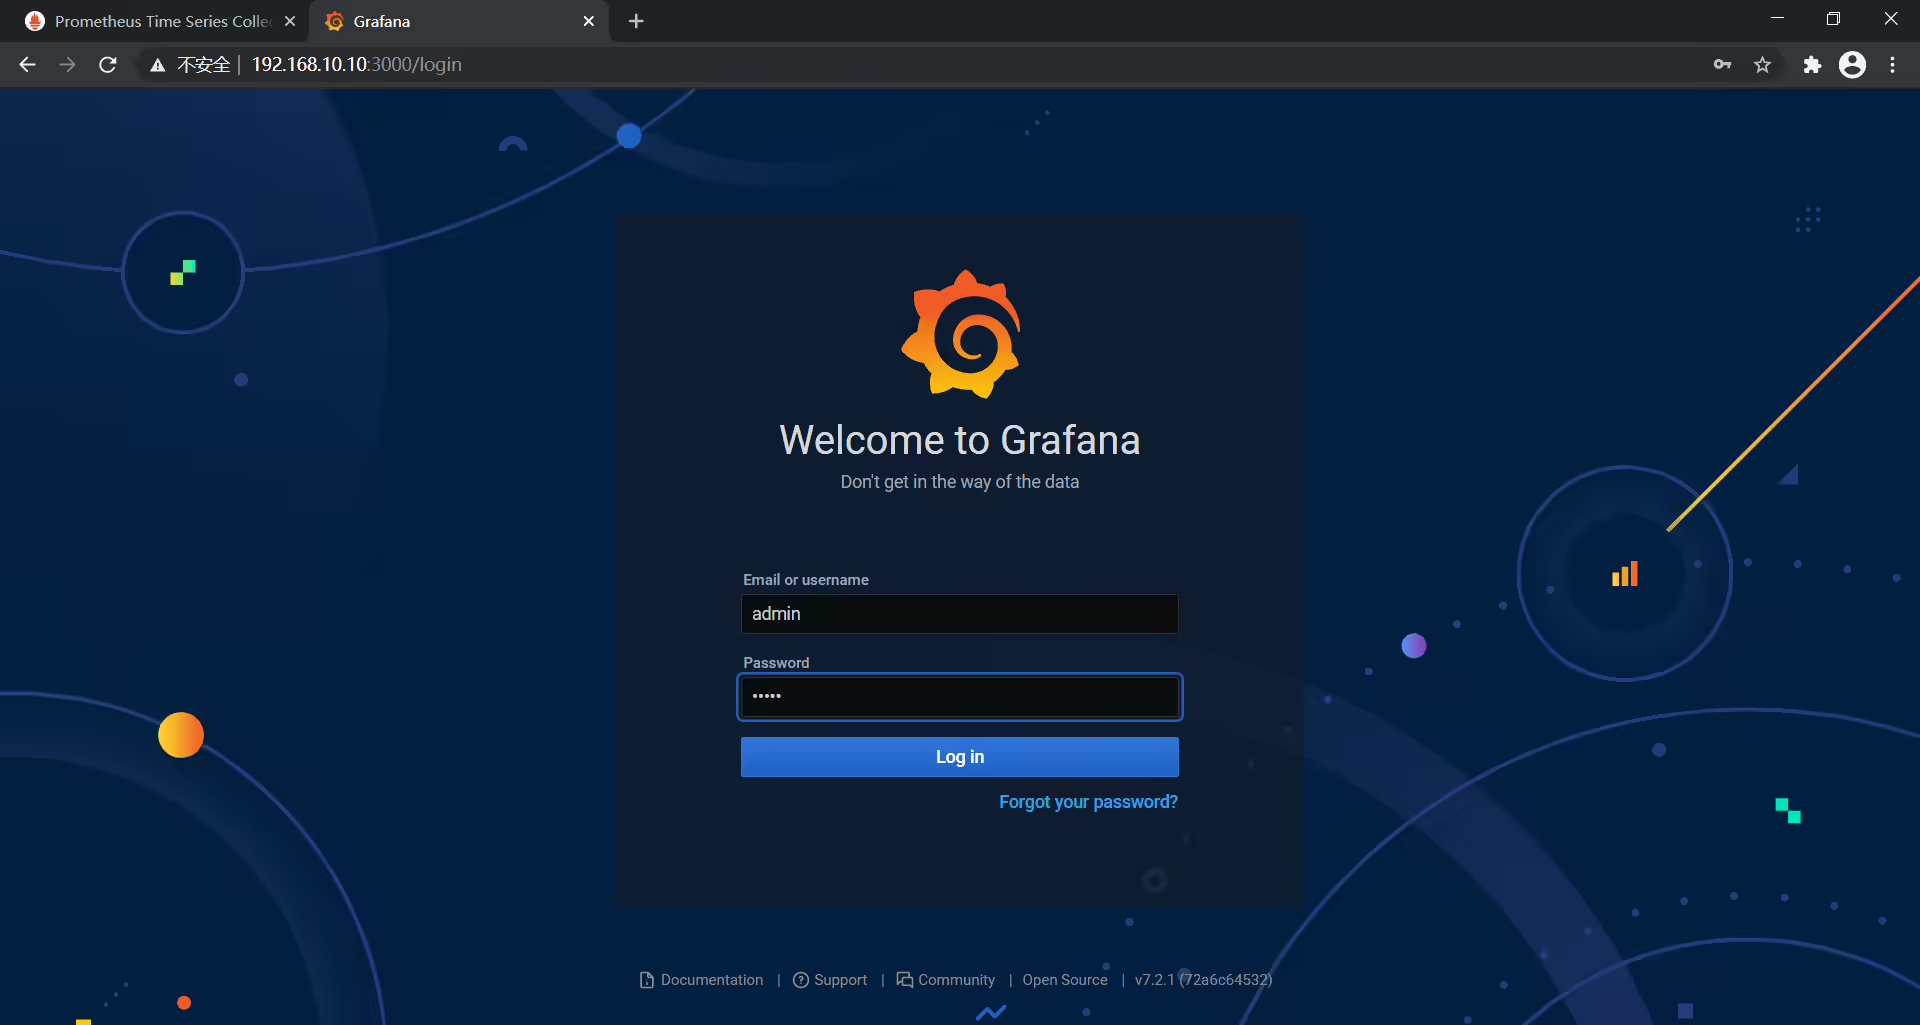

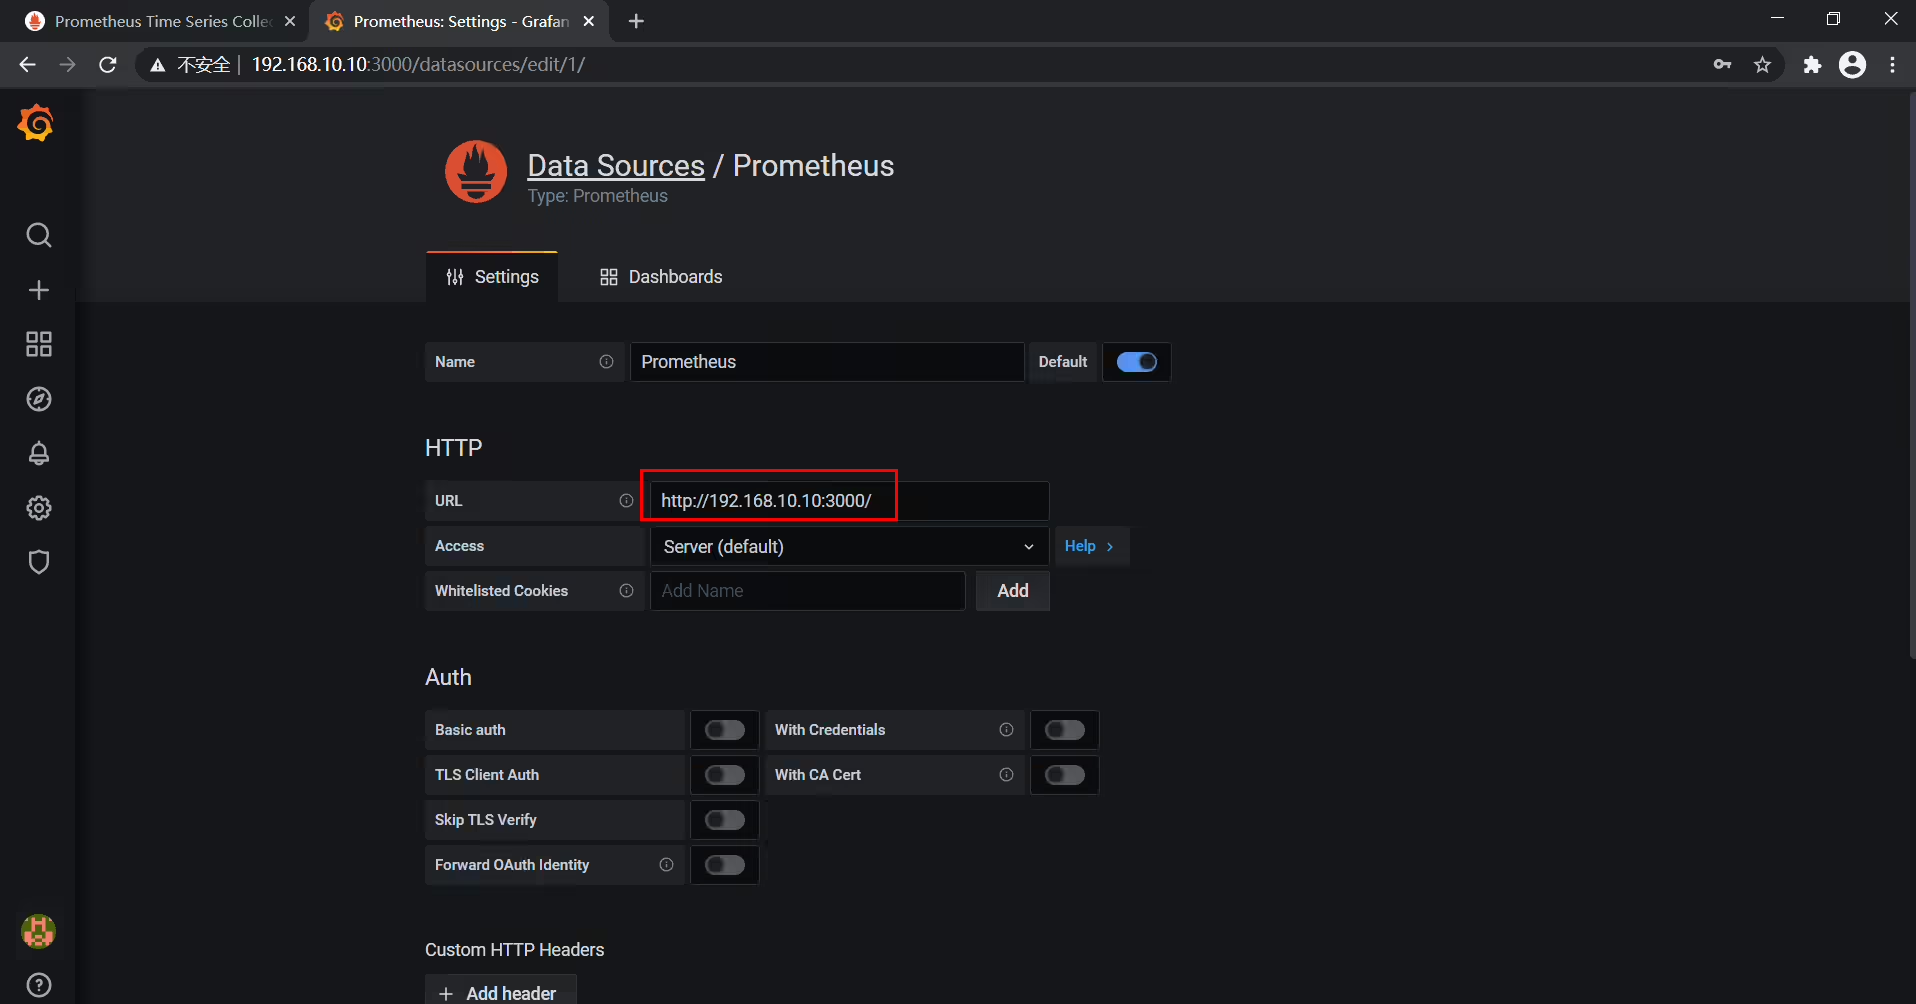
接下来我们把grafana和prometheus关联起来,也就是在grafana中添加数据源。
在数据源这里选择第一个prometheus,点击save &test就可以了。
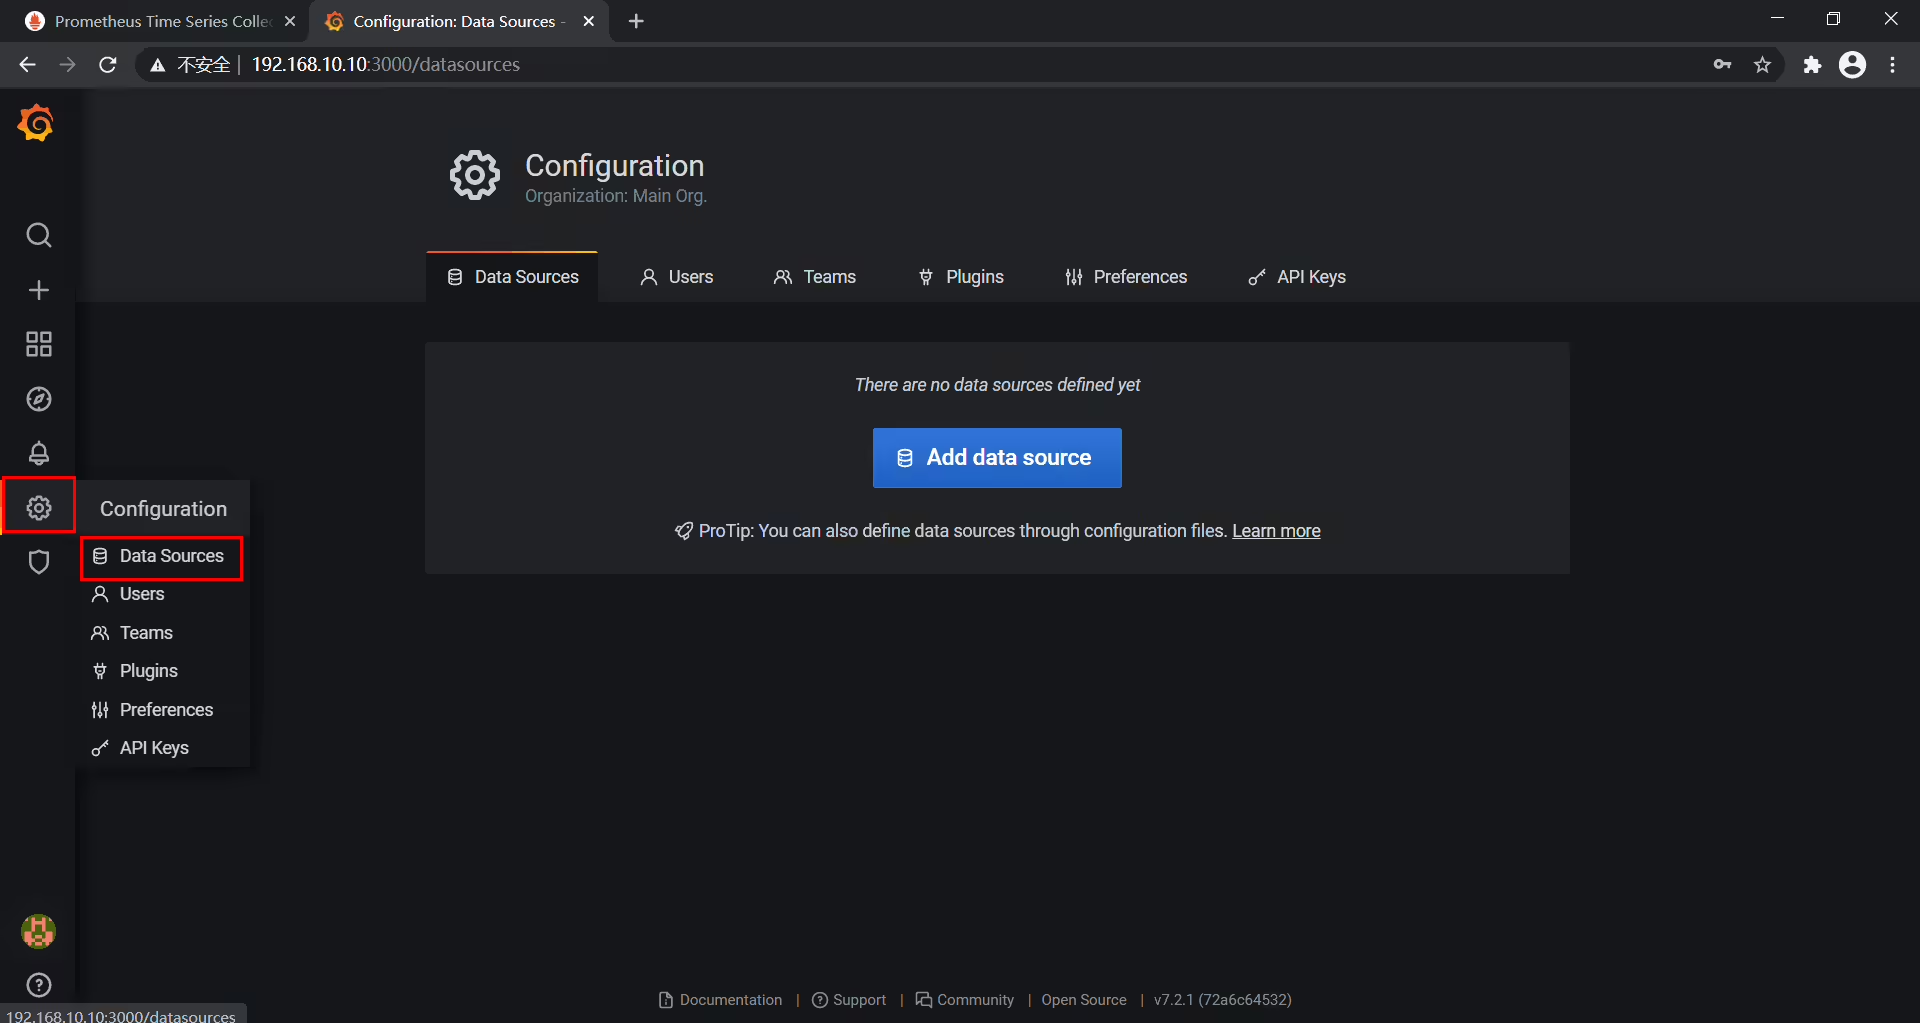
按照上面的指导添加数据源之后,我们就可以针对这些数据来绘制图表了。
grafana最人性化的一点就是拥有大量的图表模板,我们只需要导入模板即可,从而省去了大量的制作图表的时间。
目前我们的prometheus还没有什么监控数据,只有prometheus本身的数据,我们看下这些prometheus本身数据图表是怎样的。
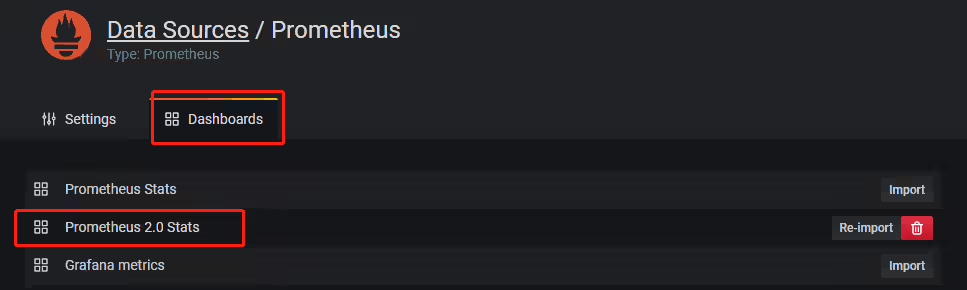
在添加数据源的位置上,右边的选项有个Dashboards的菜单选项,我们点击进去,然后导入prometheus2.0.
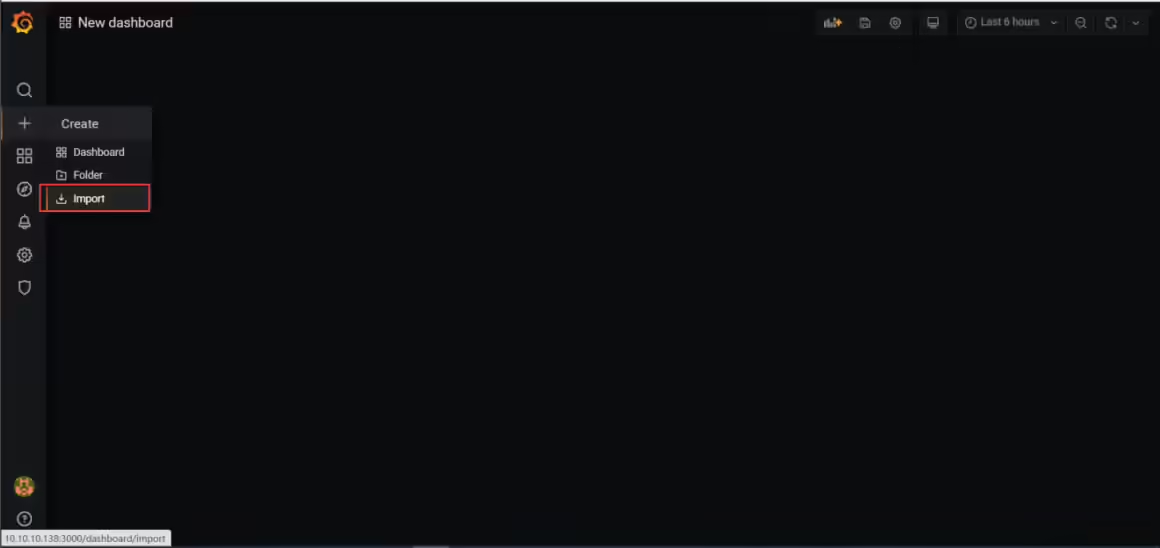
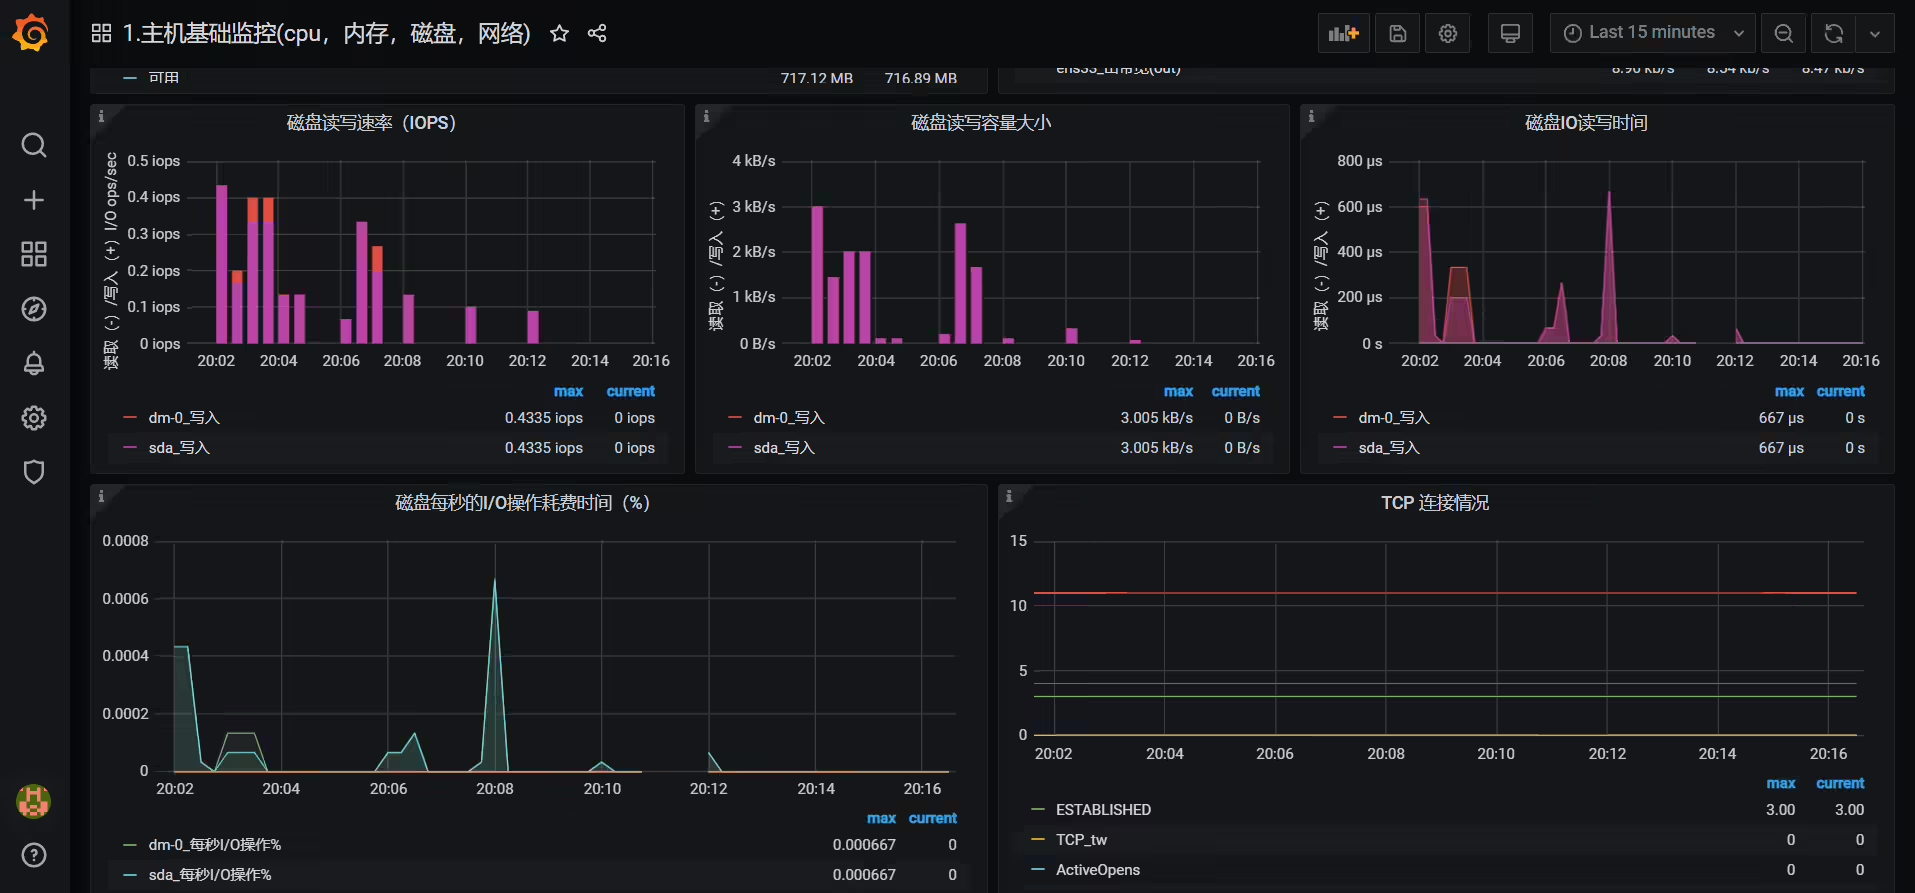
模板文件:主机基础监控(cpu,内存,磁盘,网络).json,将其导入即可;

接下来就可以去查看这个图表了。


至此,实验搭建结束。
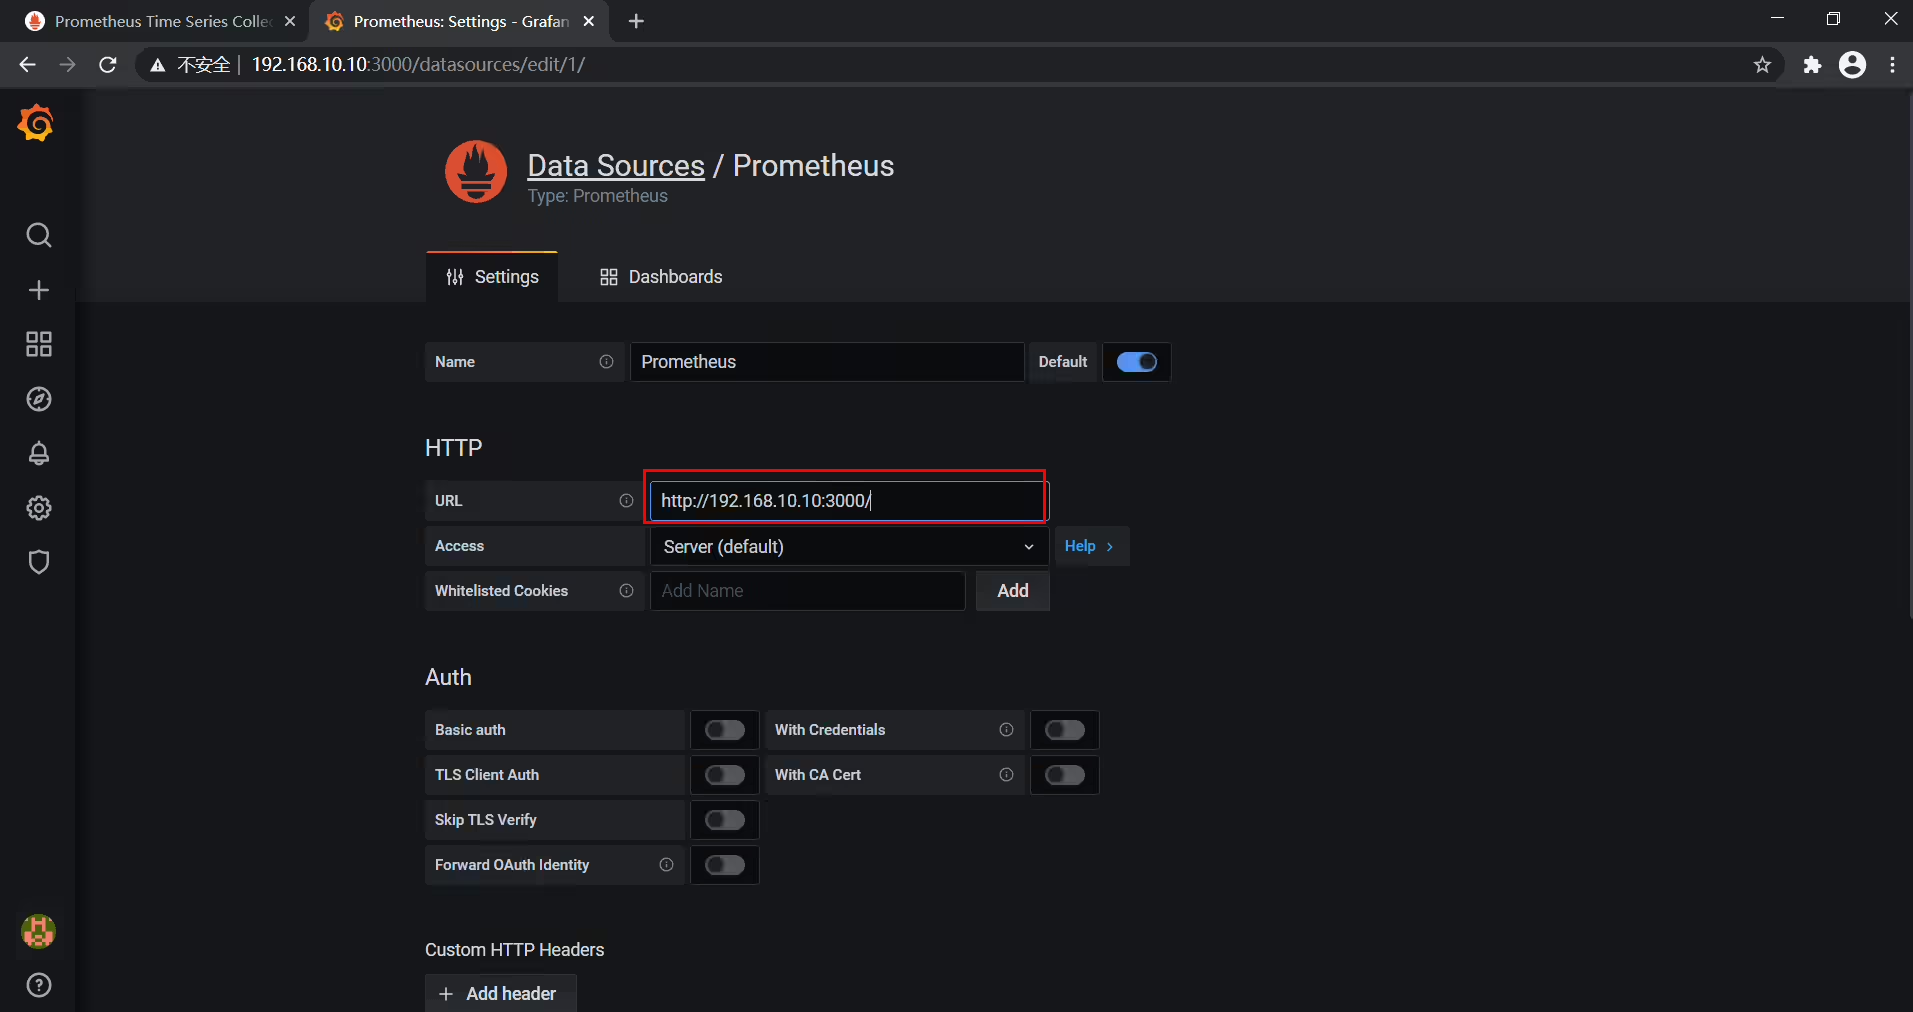
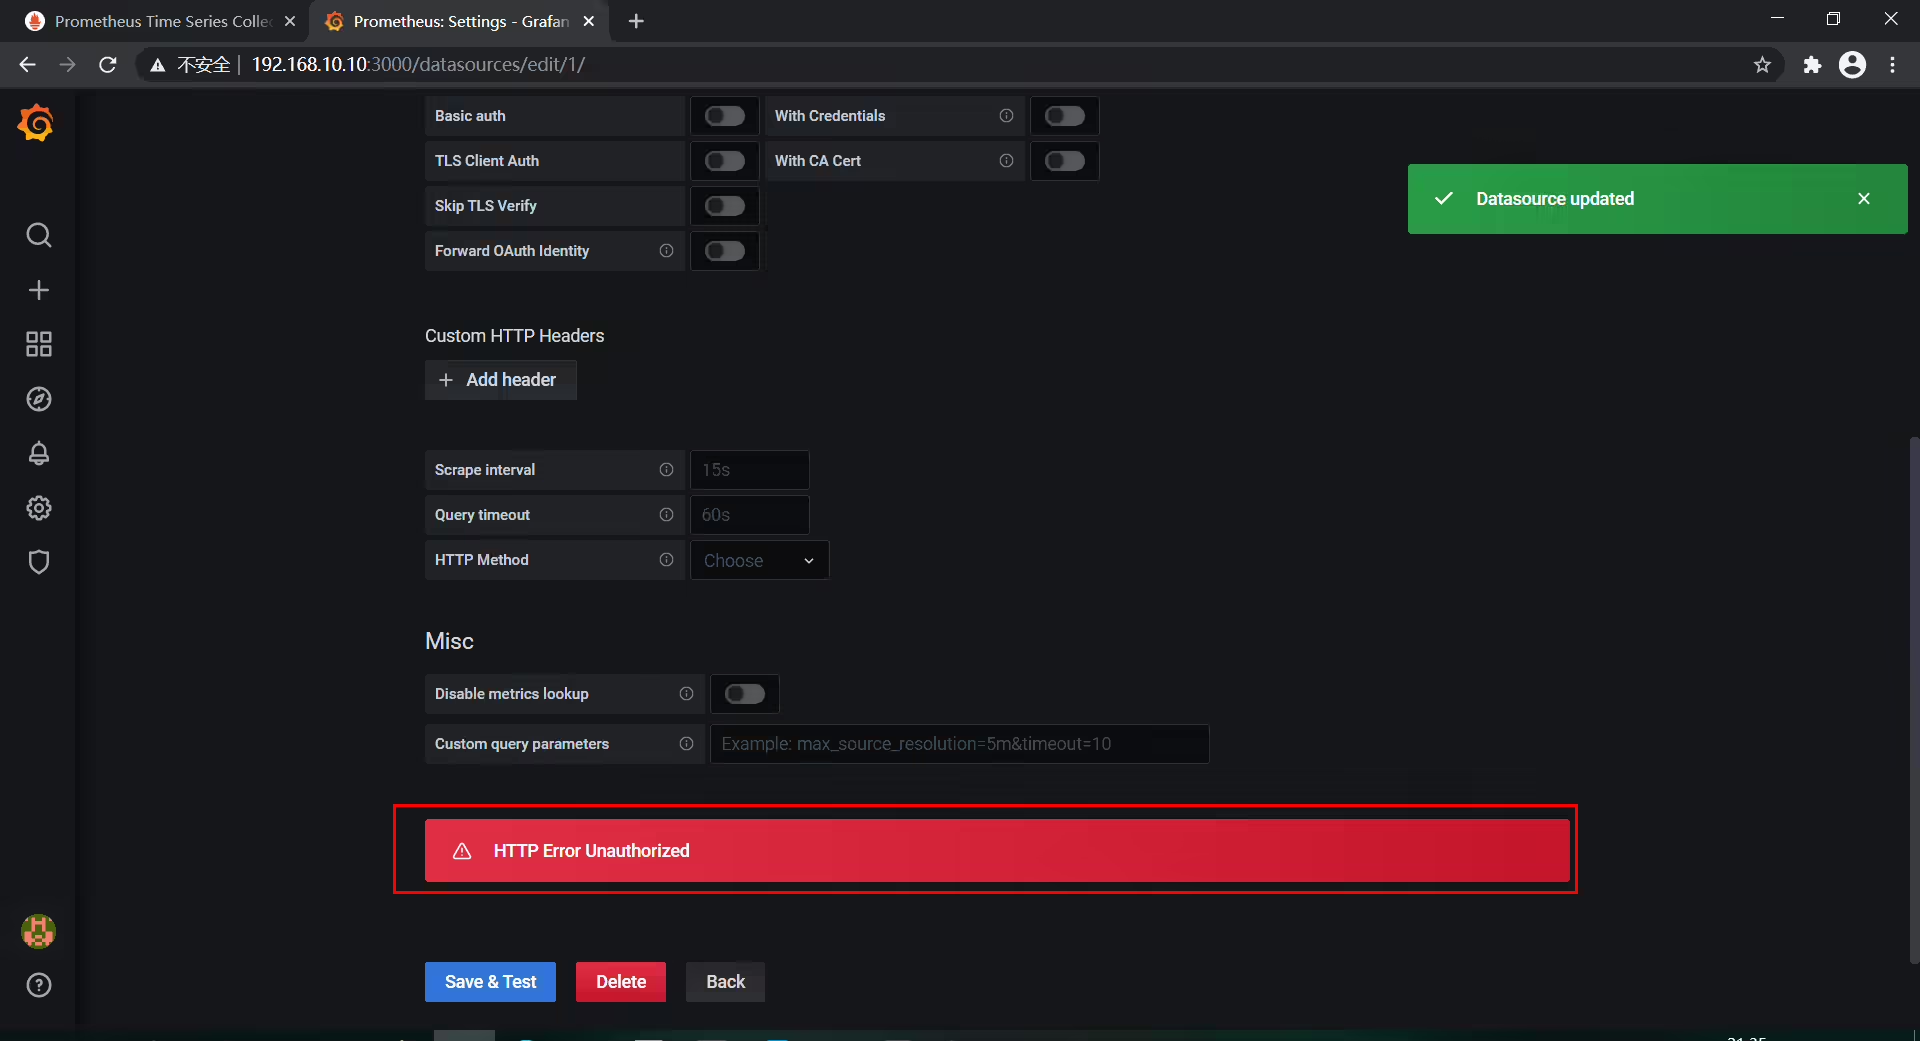
grafana连接prometheus导入数据源时报错:
#原来都是按实验文档这样做得,没报错,这次竟然报错了,好奇怪??;(2020.1.31)先搁置。。。
我的博客主旨:
🍀 微信二维码
x2675263825 (舍得), qq:2675263825。

🍀 微信公众号
《云原生架构师实战》

🍀 个人博客站点


🍀 语雀
https://www.yuque.com/xyy-onlyone

🍀 csdn
https://blog.csdn.net/weixin_39246554?spm=1010.2135.3001.5421

🍀 知乎
https://www.zhihu.com/people/foryouone

好了,关于本次就到这里了,感谢大家阅读,最后祝大家生活快乐,每天都过的有意义哦,我们下期见!

精选 · 友链 · 更多

One的公众号
爱折腾博客的小白